Compared samples: one EB H11 LEDr lamp and one OSRAM NIGHT BREAKER LED SMART ECE H11 LEDr lamp. Every photograph and measurement below belongs to these two samples. The complete records remain available in the individual EB H11 LEDr review and OSRAM H11 LEDr review.
Test conditions
Both lamps operated at 13.2 V in a 26°C environment. After a 30-minute warm-up, illuminance was recorded at the same E-Mark panel points from 3.5 m. Emitting-area surface temperature was also recorded at 30 minutes, and fan noise was measured from 3.5 cm.
Key Comparison Points
- Packaging: EB uses a smaller and lighter package; OSRAM uses a formed insert and printed instructions.
- Lamp construction: Both samples share the H11 connector, PGJ19-2 keyed base and metal retaining spring. Their rear heat sinks, cables and external drivers differ.
- Emitting geometry: EB has a continuous rectangular emitting window and a smaller distance between opposing LED emitting surfaces. The illuminated Box-system images show different B1–B3 coverage.
- Beam and illuminance: Both samples produce a central-right hotspot. EB is higher at the right-side and peak points, while OSRAM is higher through the centre-left and slightly lower at B50L.
- Temperature and noise: EB records the lower emitting-area surface temperature after 30 minutes; OSRAM records the lower fan-noise level at 3.5 cm.
1.Packaging Section
Compare the contents, package size and empty-box weight to assess storage space and transport burden.
Package and included contents
The first comparison covers kit contents and how the package organises them.
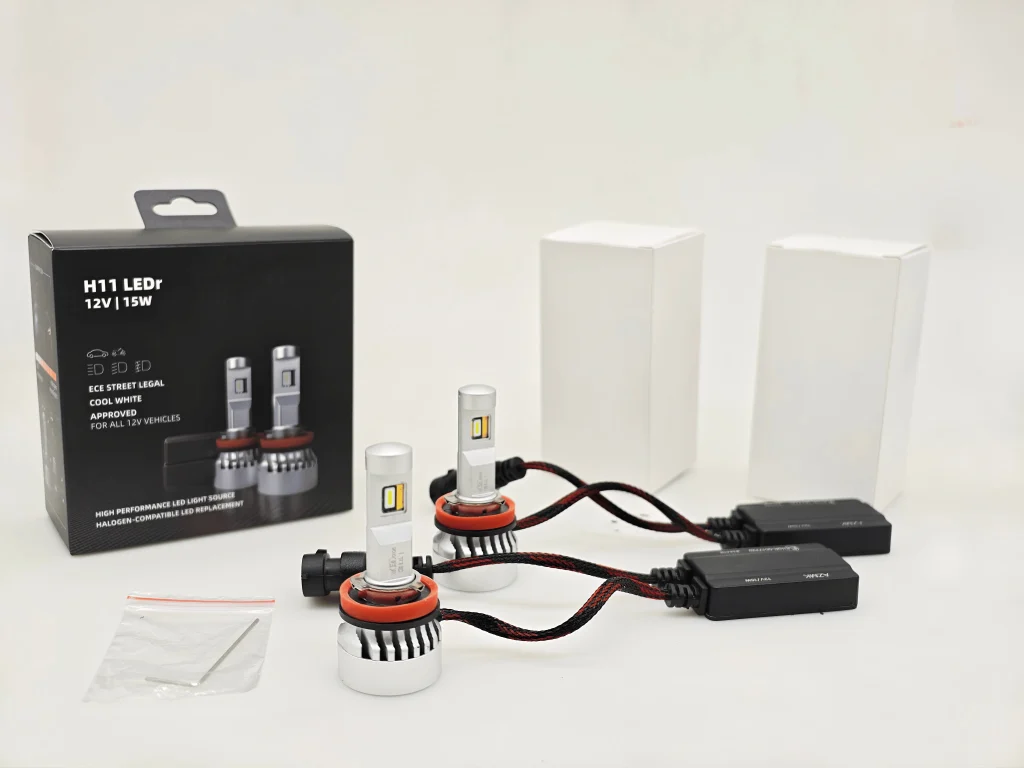
Package and included contents supplied with the reviewed EB H11 LEDr.
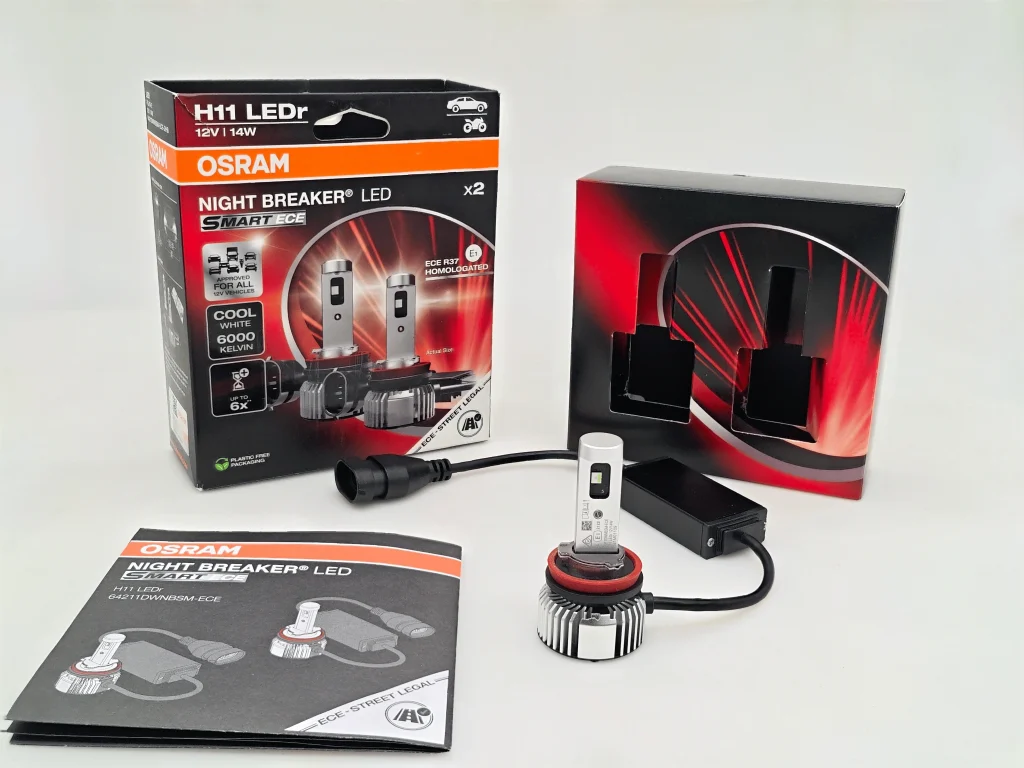
Package and included contents supplied with the reviewed OSRAM H11 LEDr.
Included contents: EB is shown with two lamps, two external drivers, two plain inner boxes and an accessory bag. OSRAM includes a formed insert and printed installation instructions.
External package dimensions
External package dimensions affect warehouse space, carton density and the per-unit logistics burden when charges are volume-based.
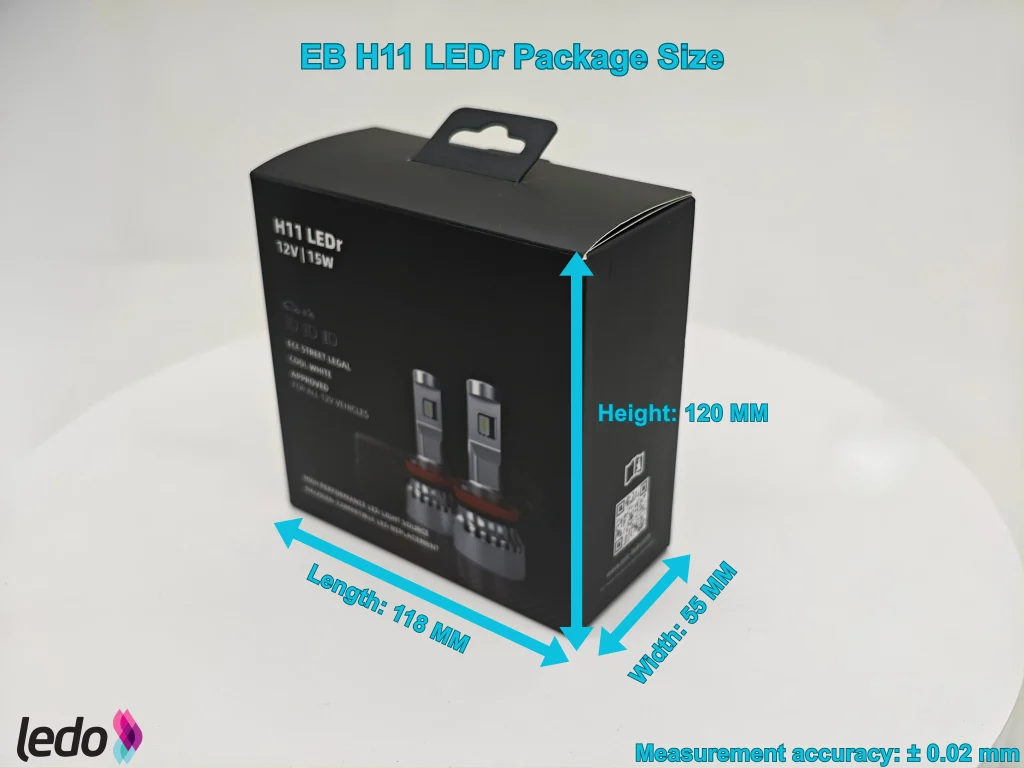
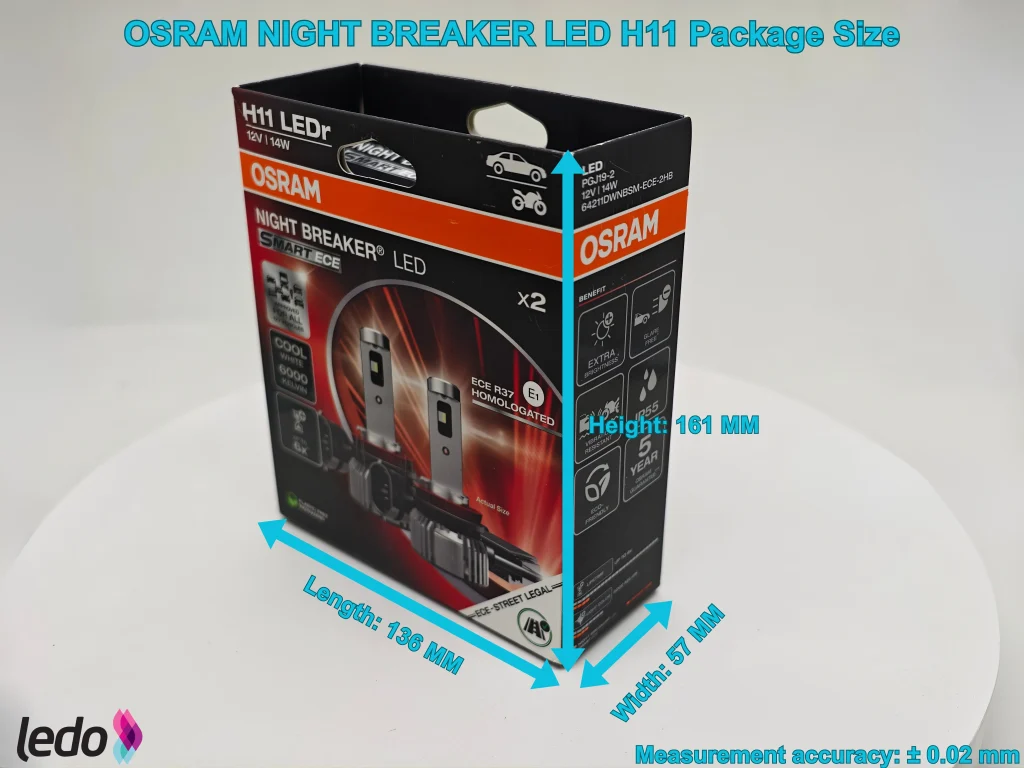
Dimensions and volume:The EB package measures 118 × 55 × 120 mm, with a nominal external volume of approximately 0.779 L. The OSRAM package measures 136 × 57 × 161 mm, approximately 1.248 L.
Empty-package weight
Empty-package mass separates product mass from the transport weight added by the packaging itself.
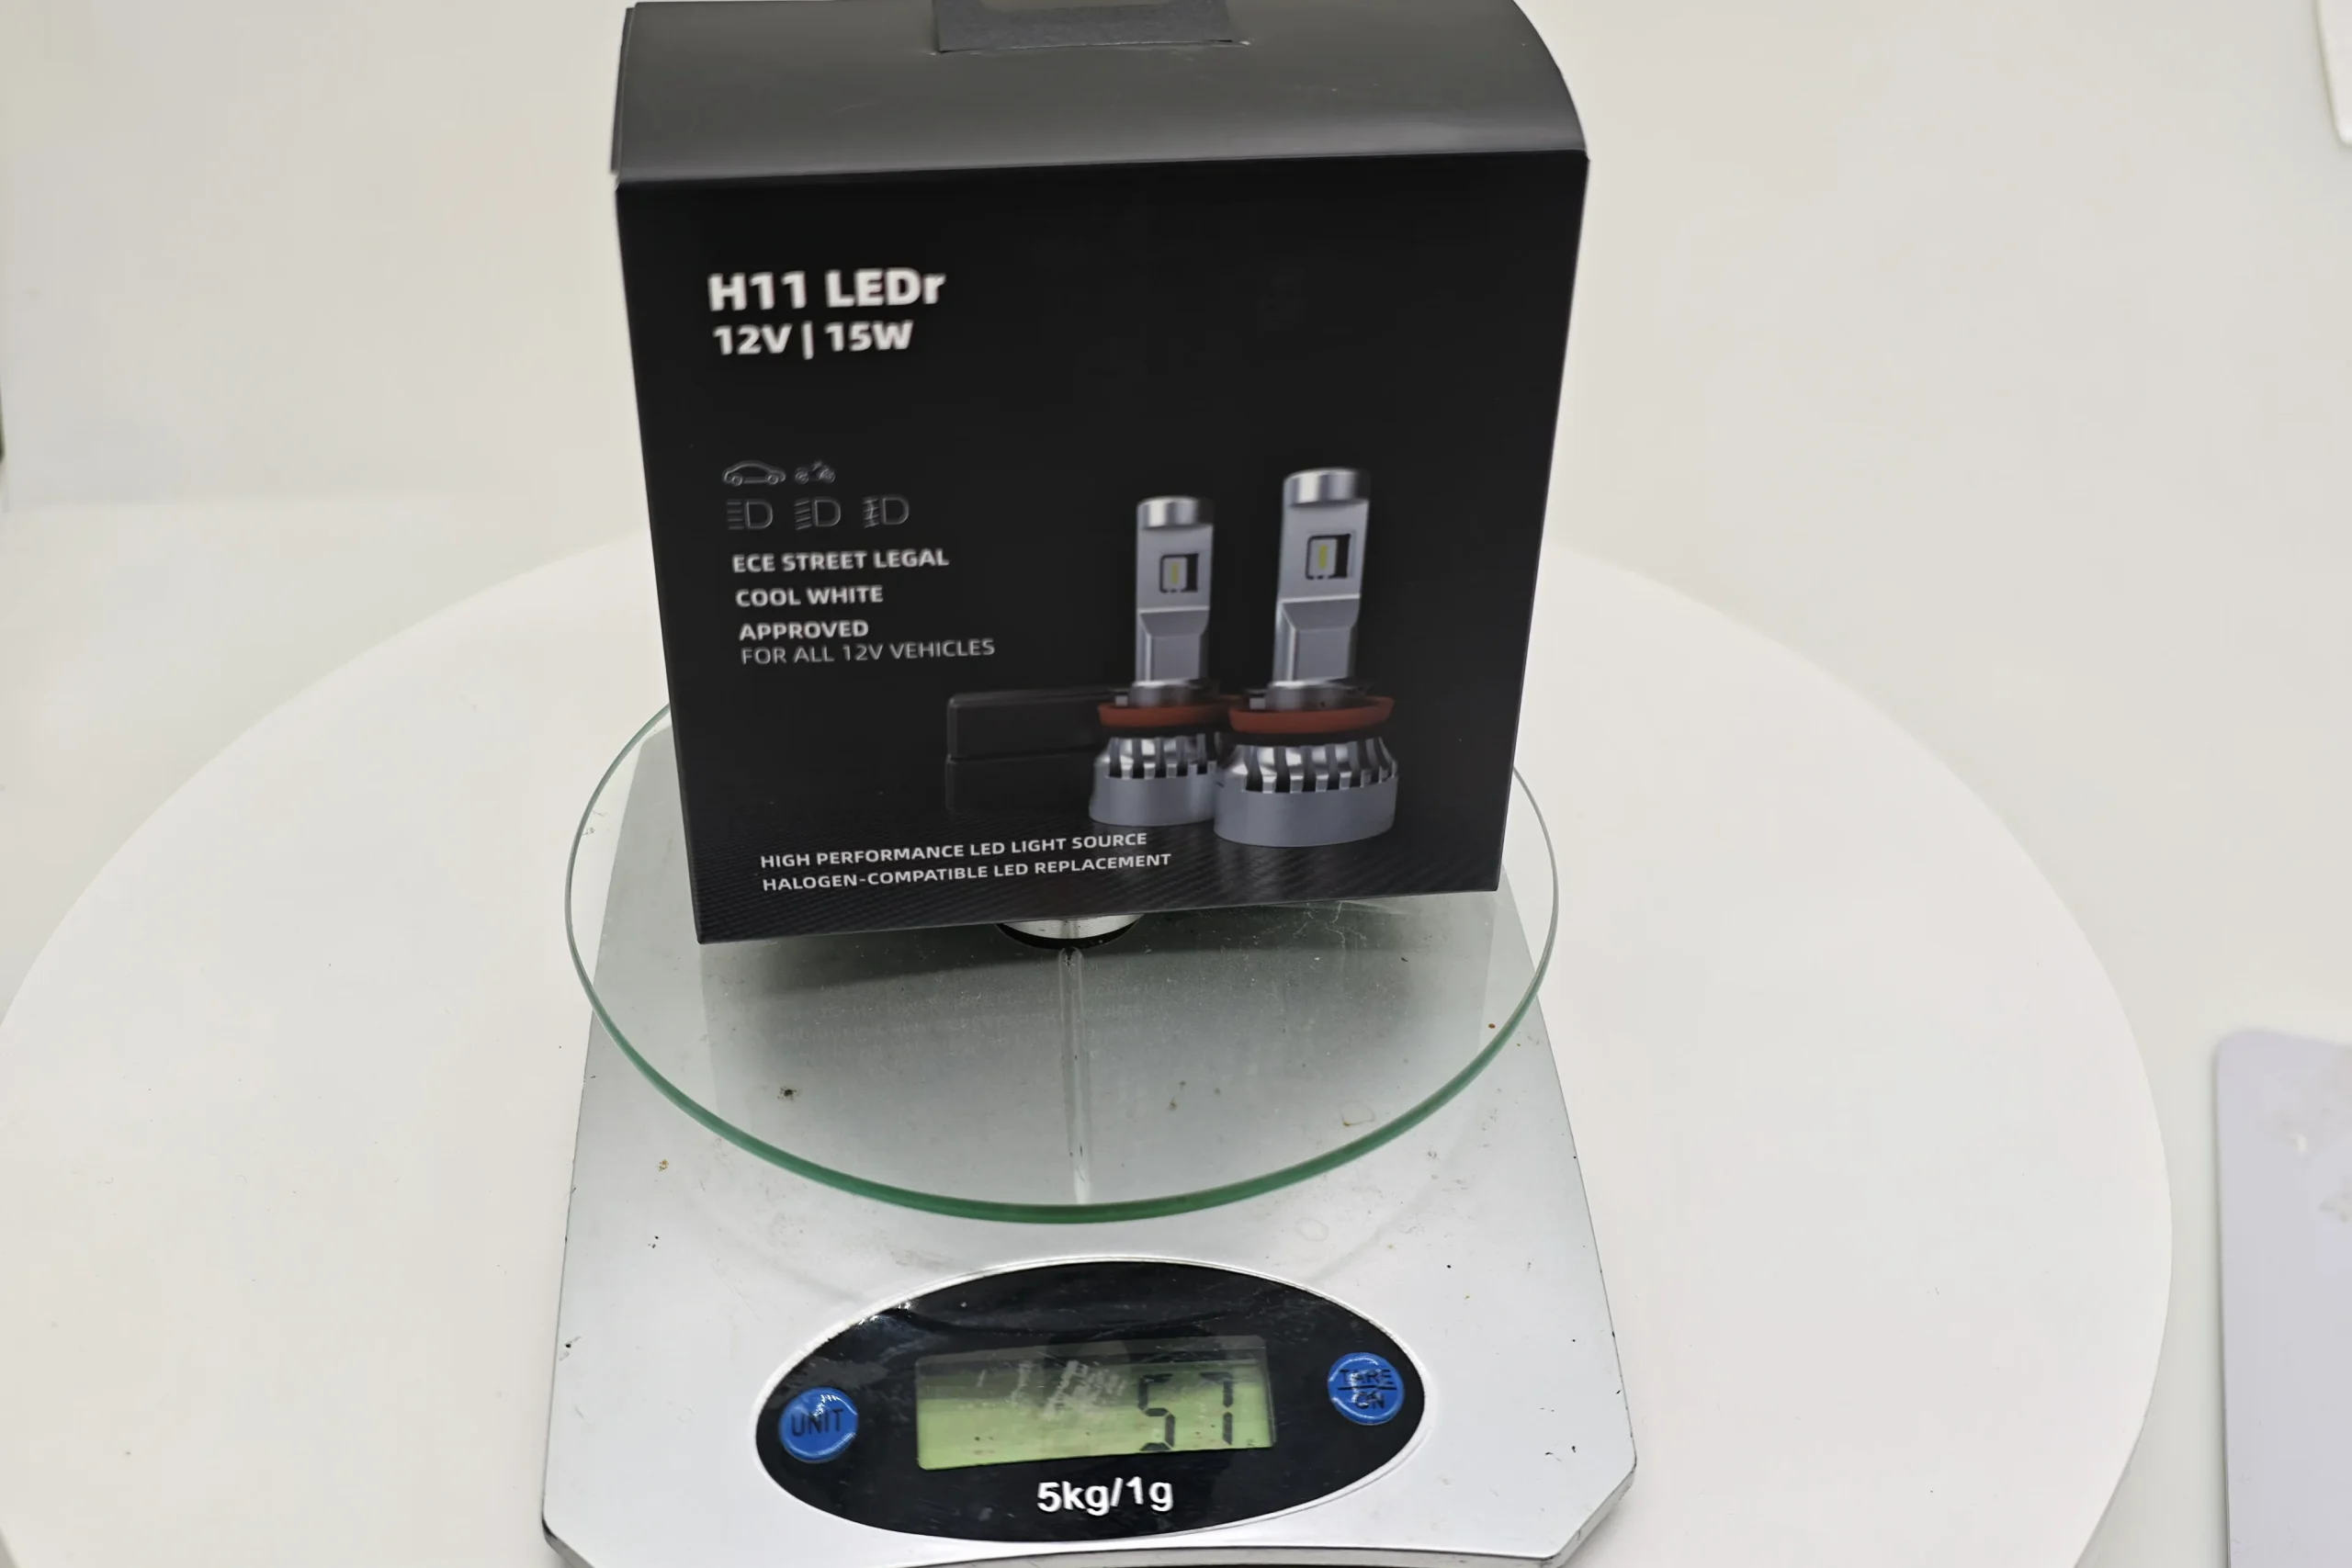
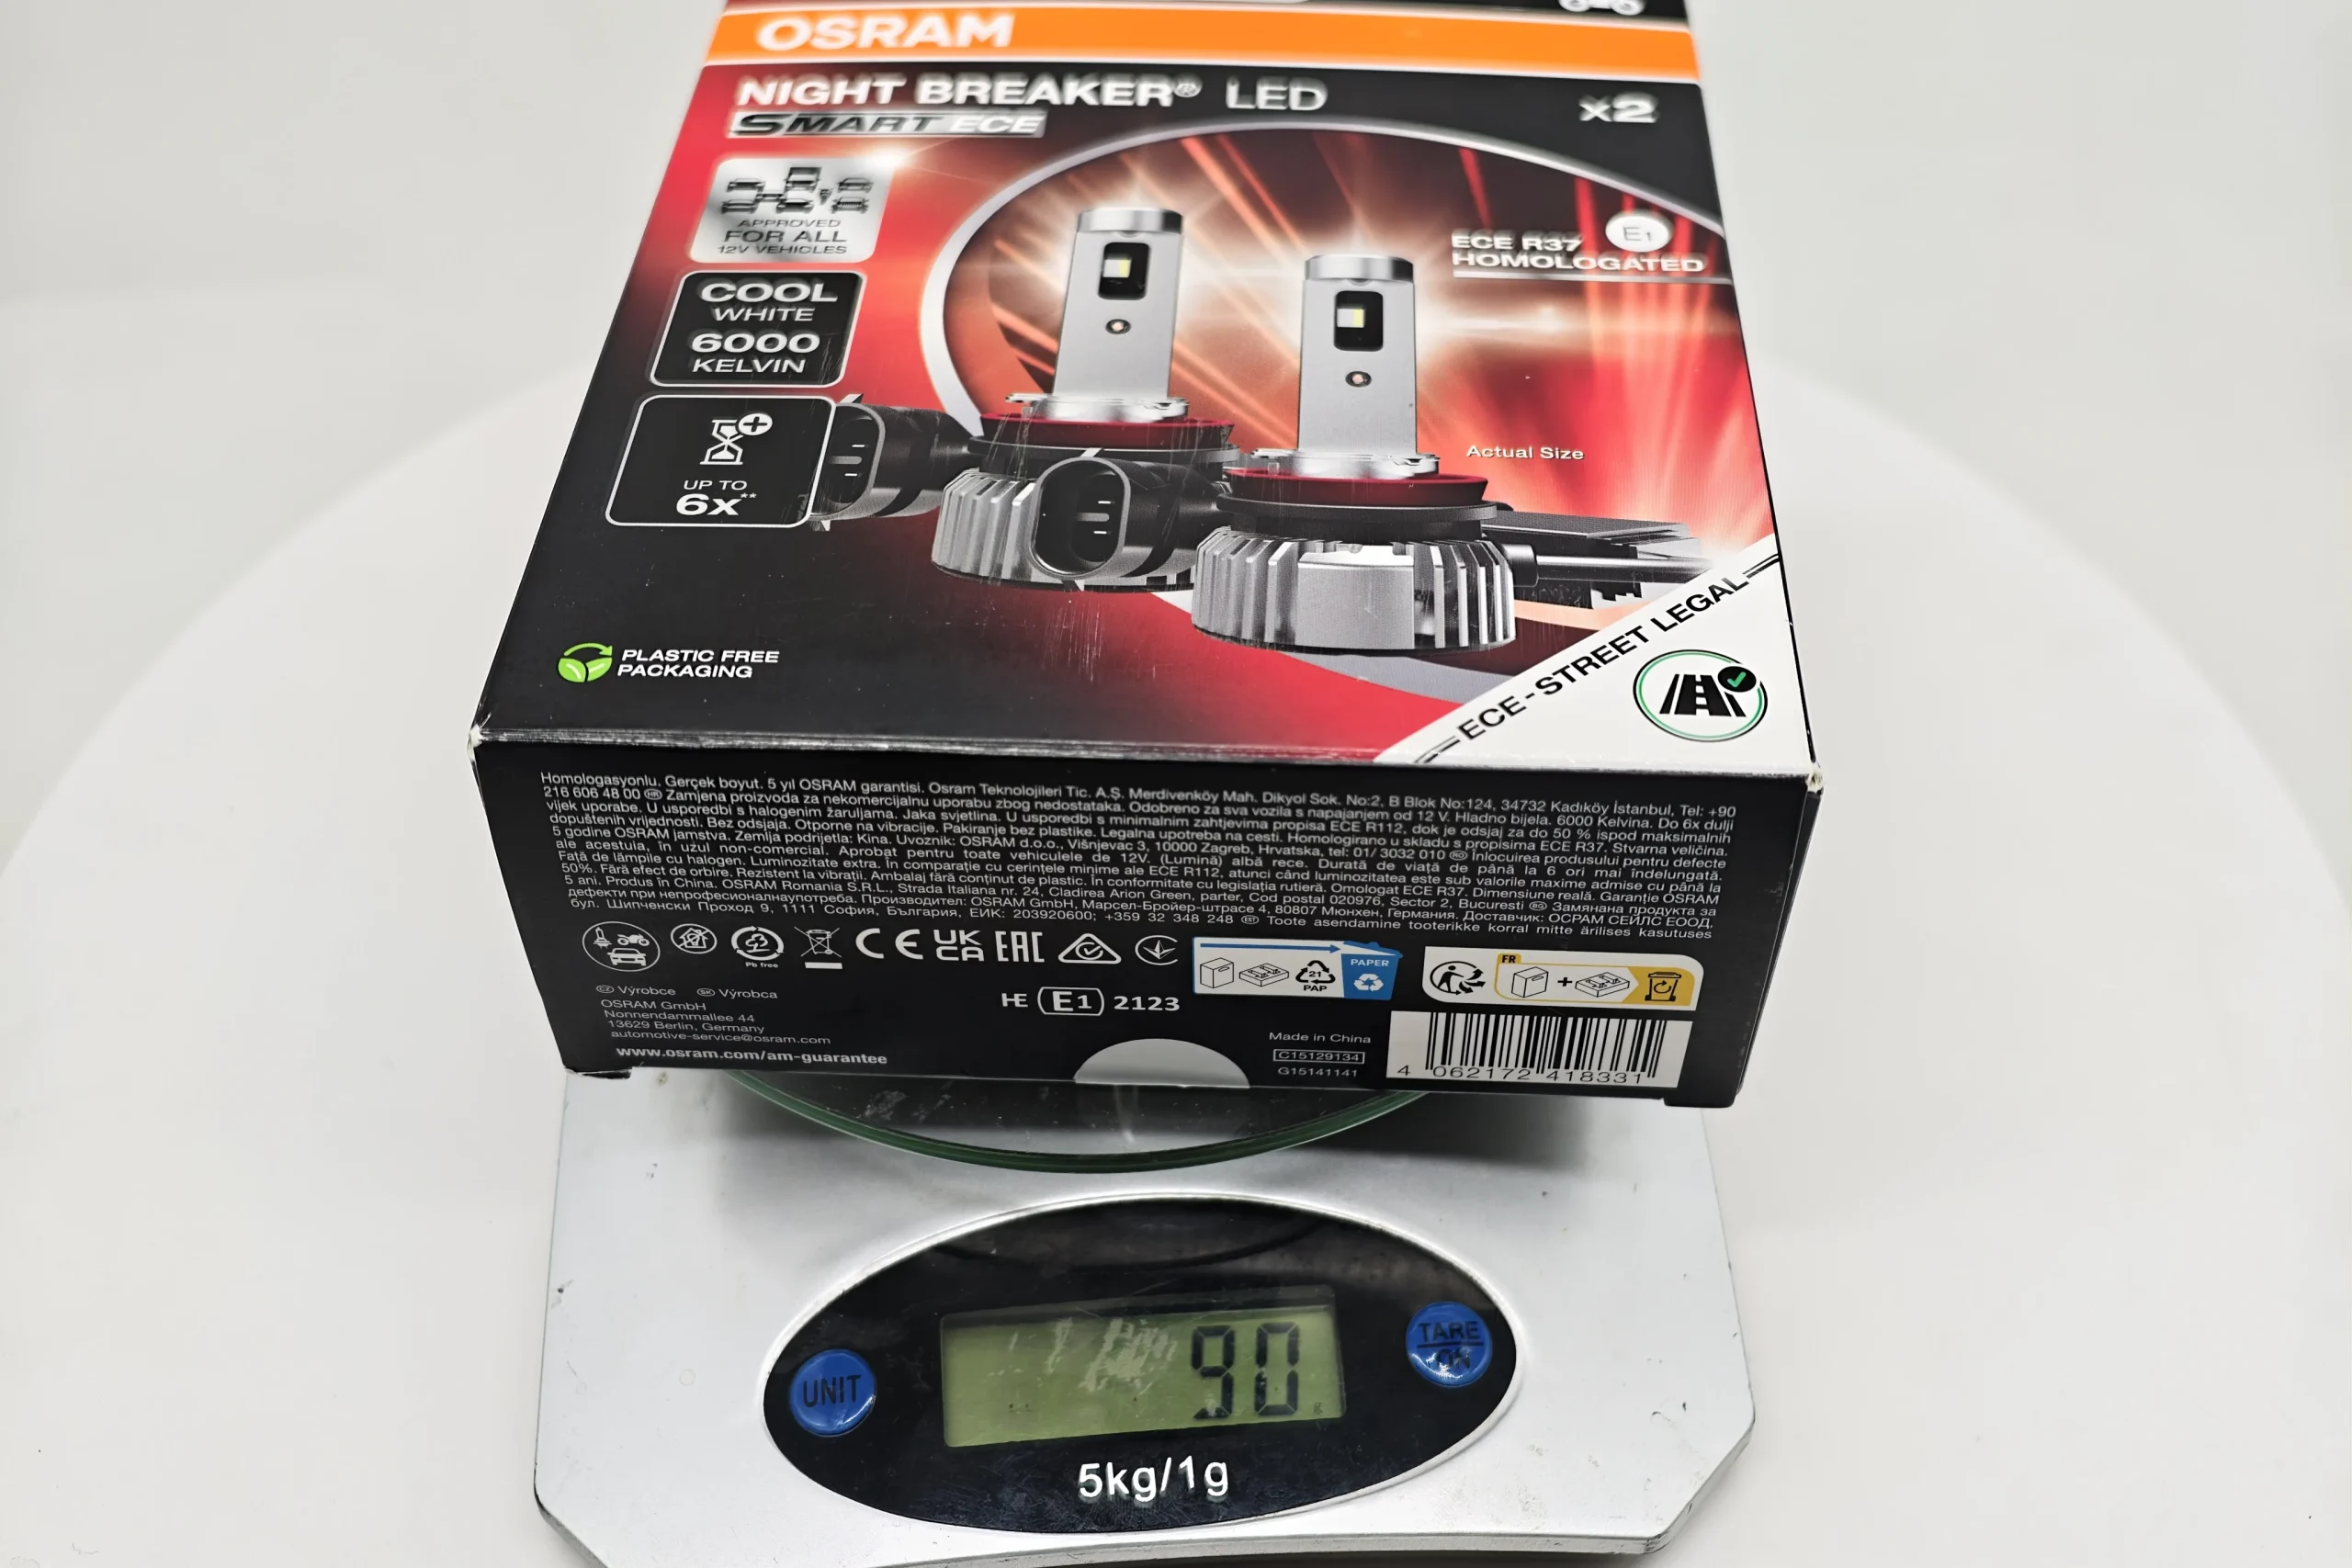
Measured mass:The EB empty package weighs 51 g and the OSRAM empty package 90 g, a difference of 39 g per box.
Packaging Size, Weight and Presentation
| Differentiating item | EB | OSRAM | Recorded difference |
|---|---|---|---|
| Package dimensions | 118 × 55 × 120 mm | 136 × 57 × 161 mm | EB package is more compact |
| Nominal external volume | 0.779 L | 1.248 L | EB is 37.60% lower |
| Empty-package mass | 51 g | 90 g | EB is 39 g lighter, a 43.33% reduction |
| Package presentation | Main hardware presented directly with two plain inner boxes | Formed insert and printed installation instructions | Different presentation methods |
Conclusion: The table shows that the EB package occupies 37.60% less volume and its empty box weighs 43.33% less. For volume buyers, the smaller box and lower packaging mass improve warehouse and master-carton utilisation while reducing transport weight attributable to packaging. OSRAM’s formed insert and printed instructions provide a more complete retail unboxing presentation.
2.Lamp Construction Comparison
Both samples use the same H11 connector, PGJ19-2 keyed base and metal retaining spring. The relevant differences are behind the base: the heat sink, cable and external driver.
Lamp and external-driver overview
The front views compare the heat-sink, cable and external-driver designs.
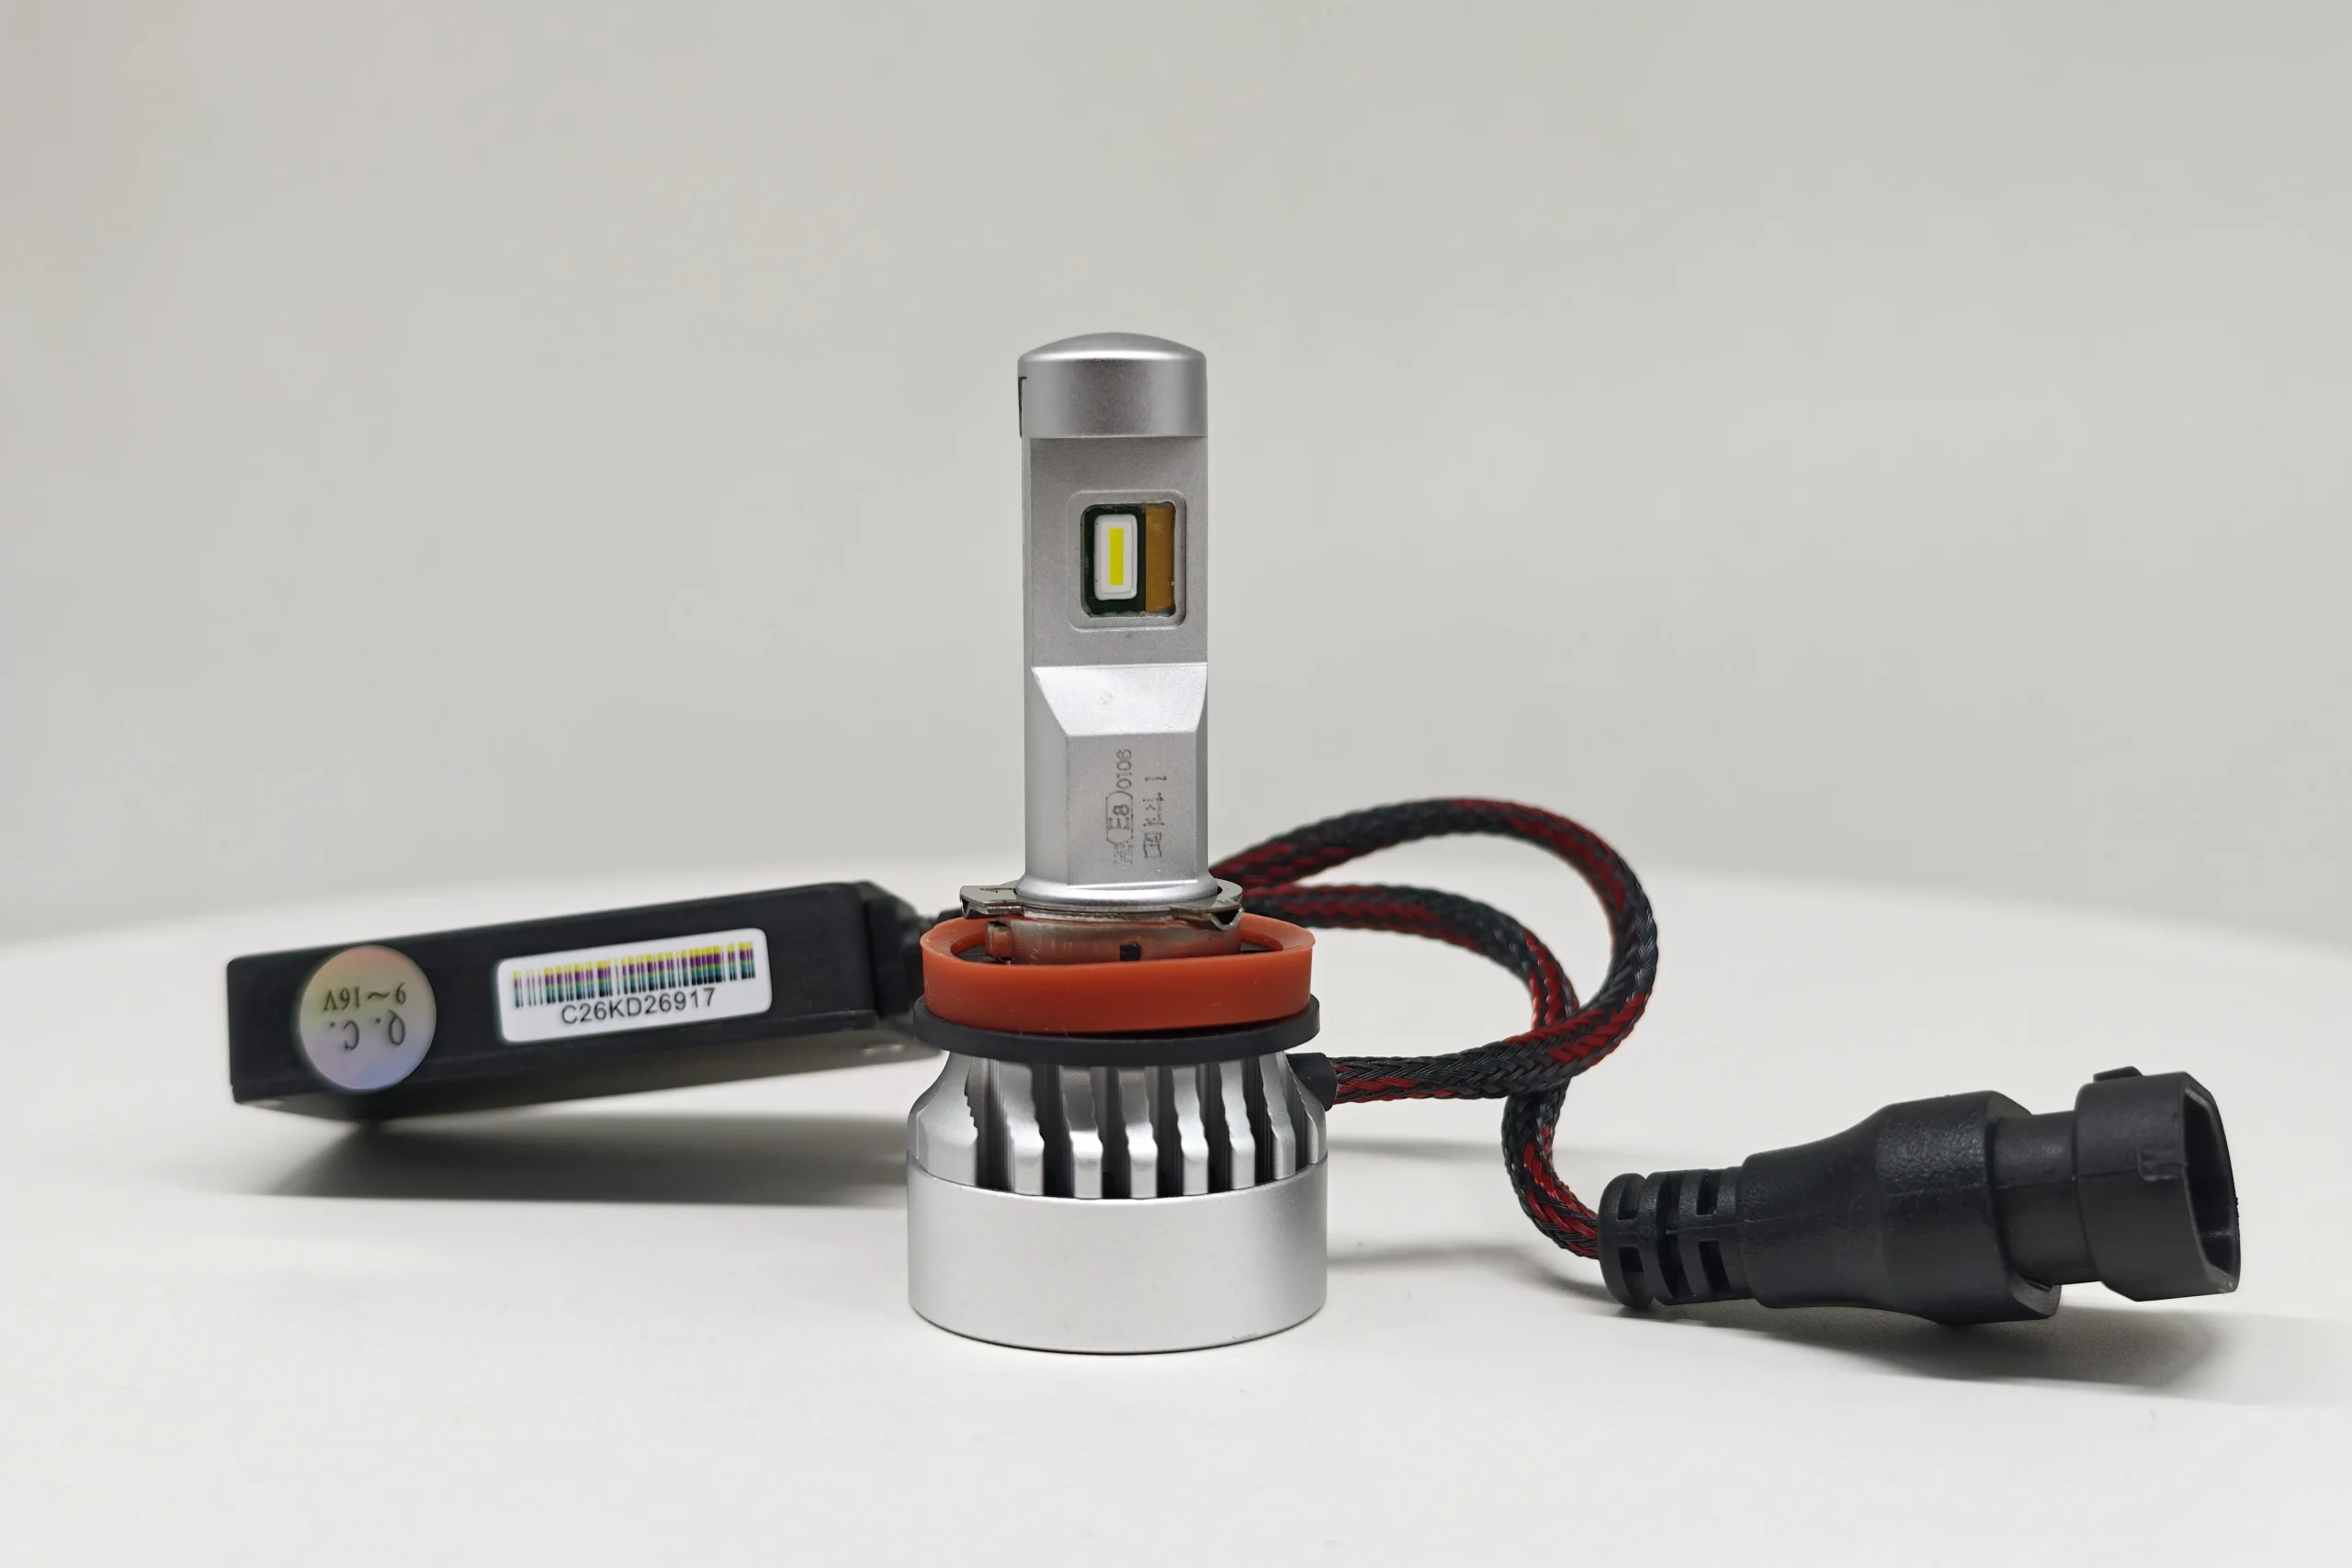
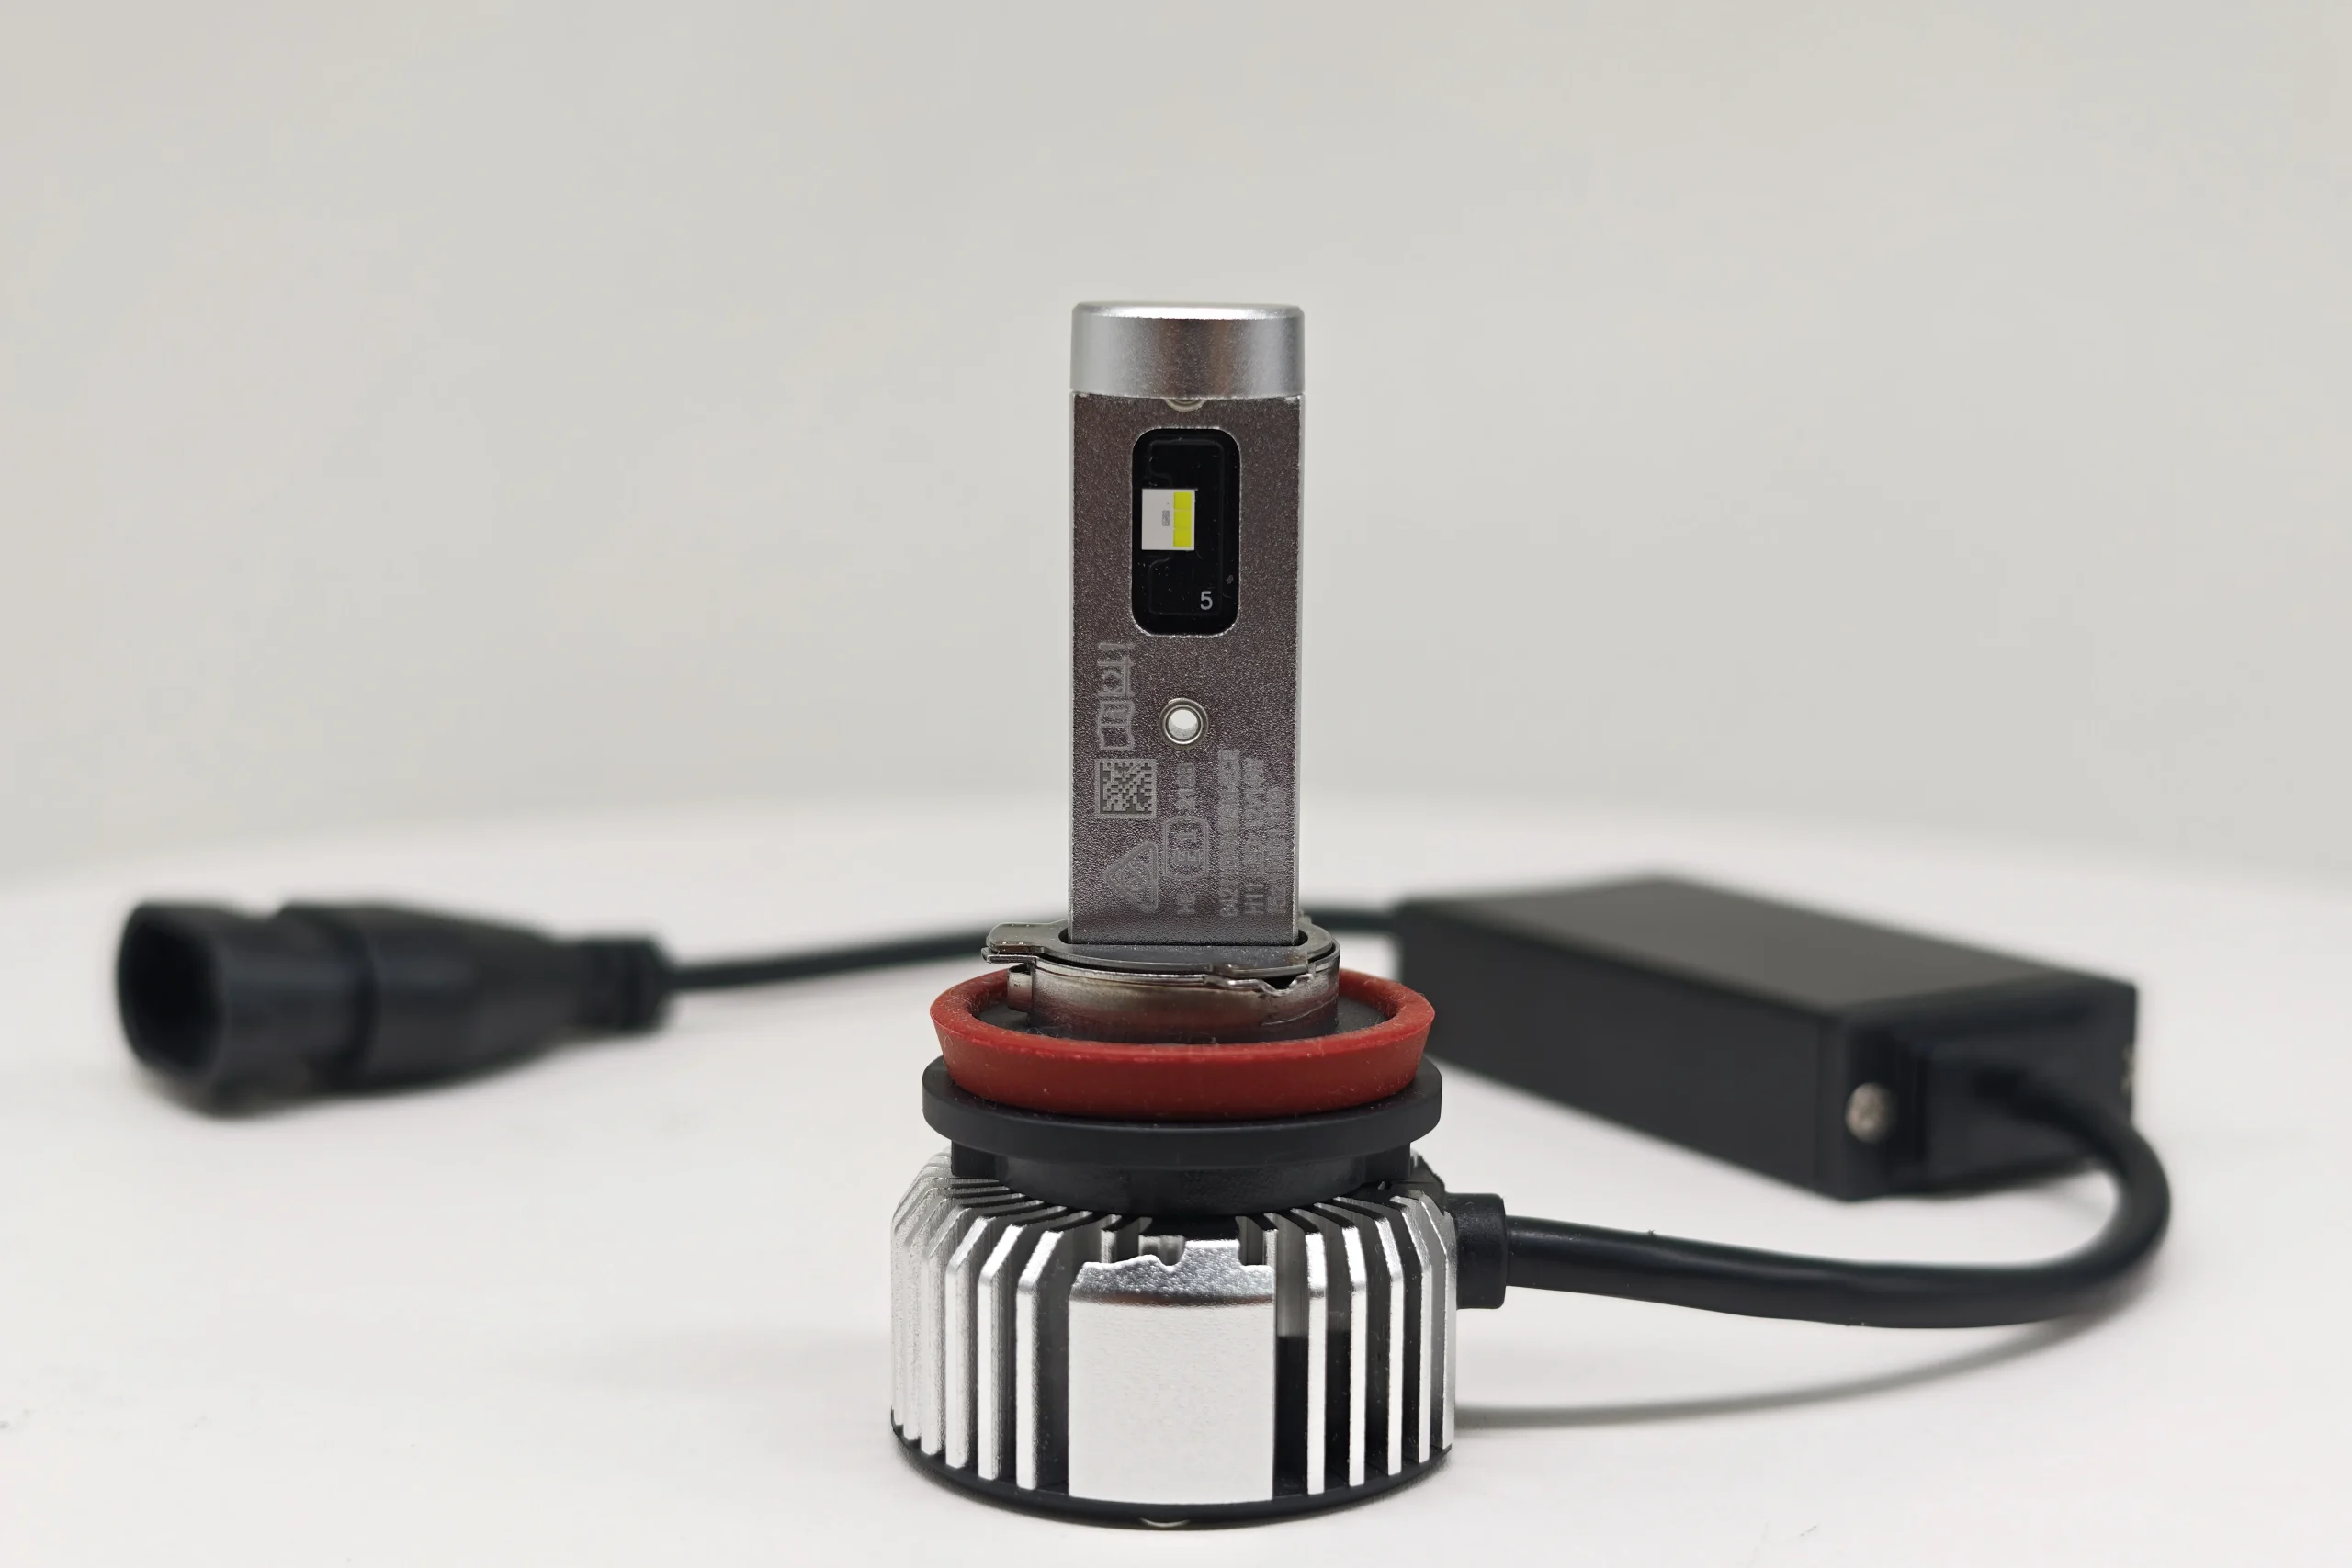
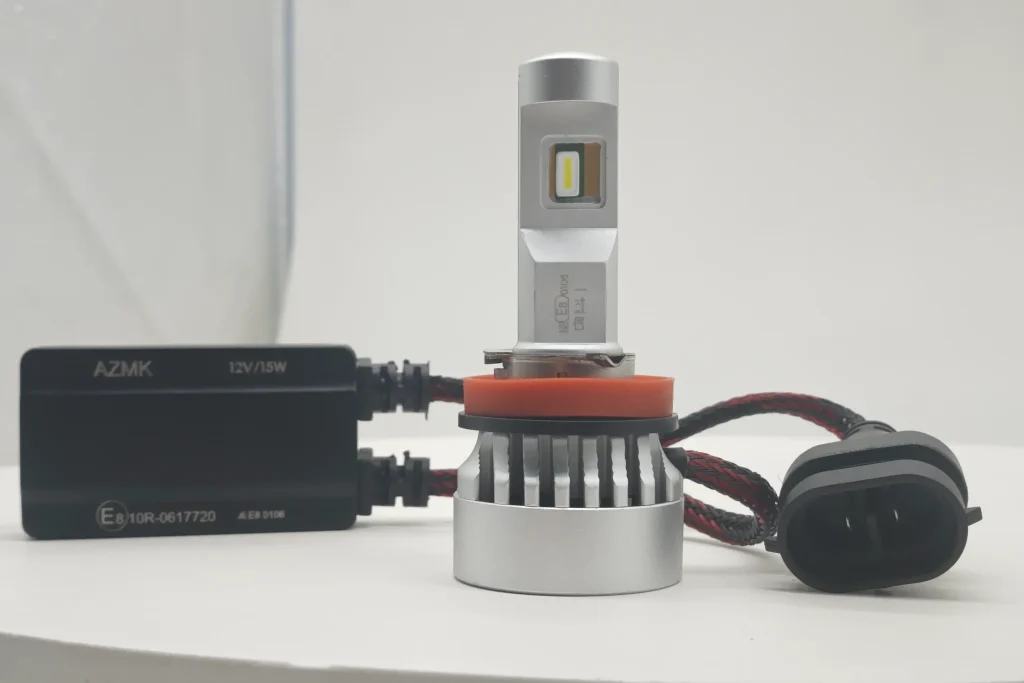
Lamp construction: Both samples use fan-assisted cooling and an external driver. EB combines a cylindrical rear heat sink with braided cable and a narrow driver housing; OSRAM uses a radial-finned heat sink, smooth black cable and a broader rectangular driver.
H11 Connector Interface
The images show the connector face used by each sample.
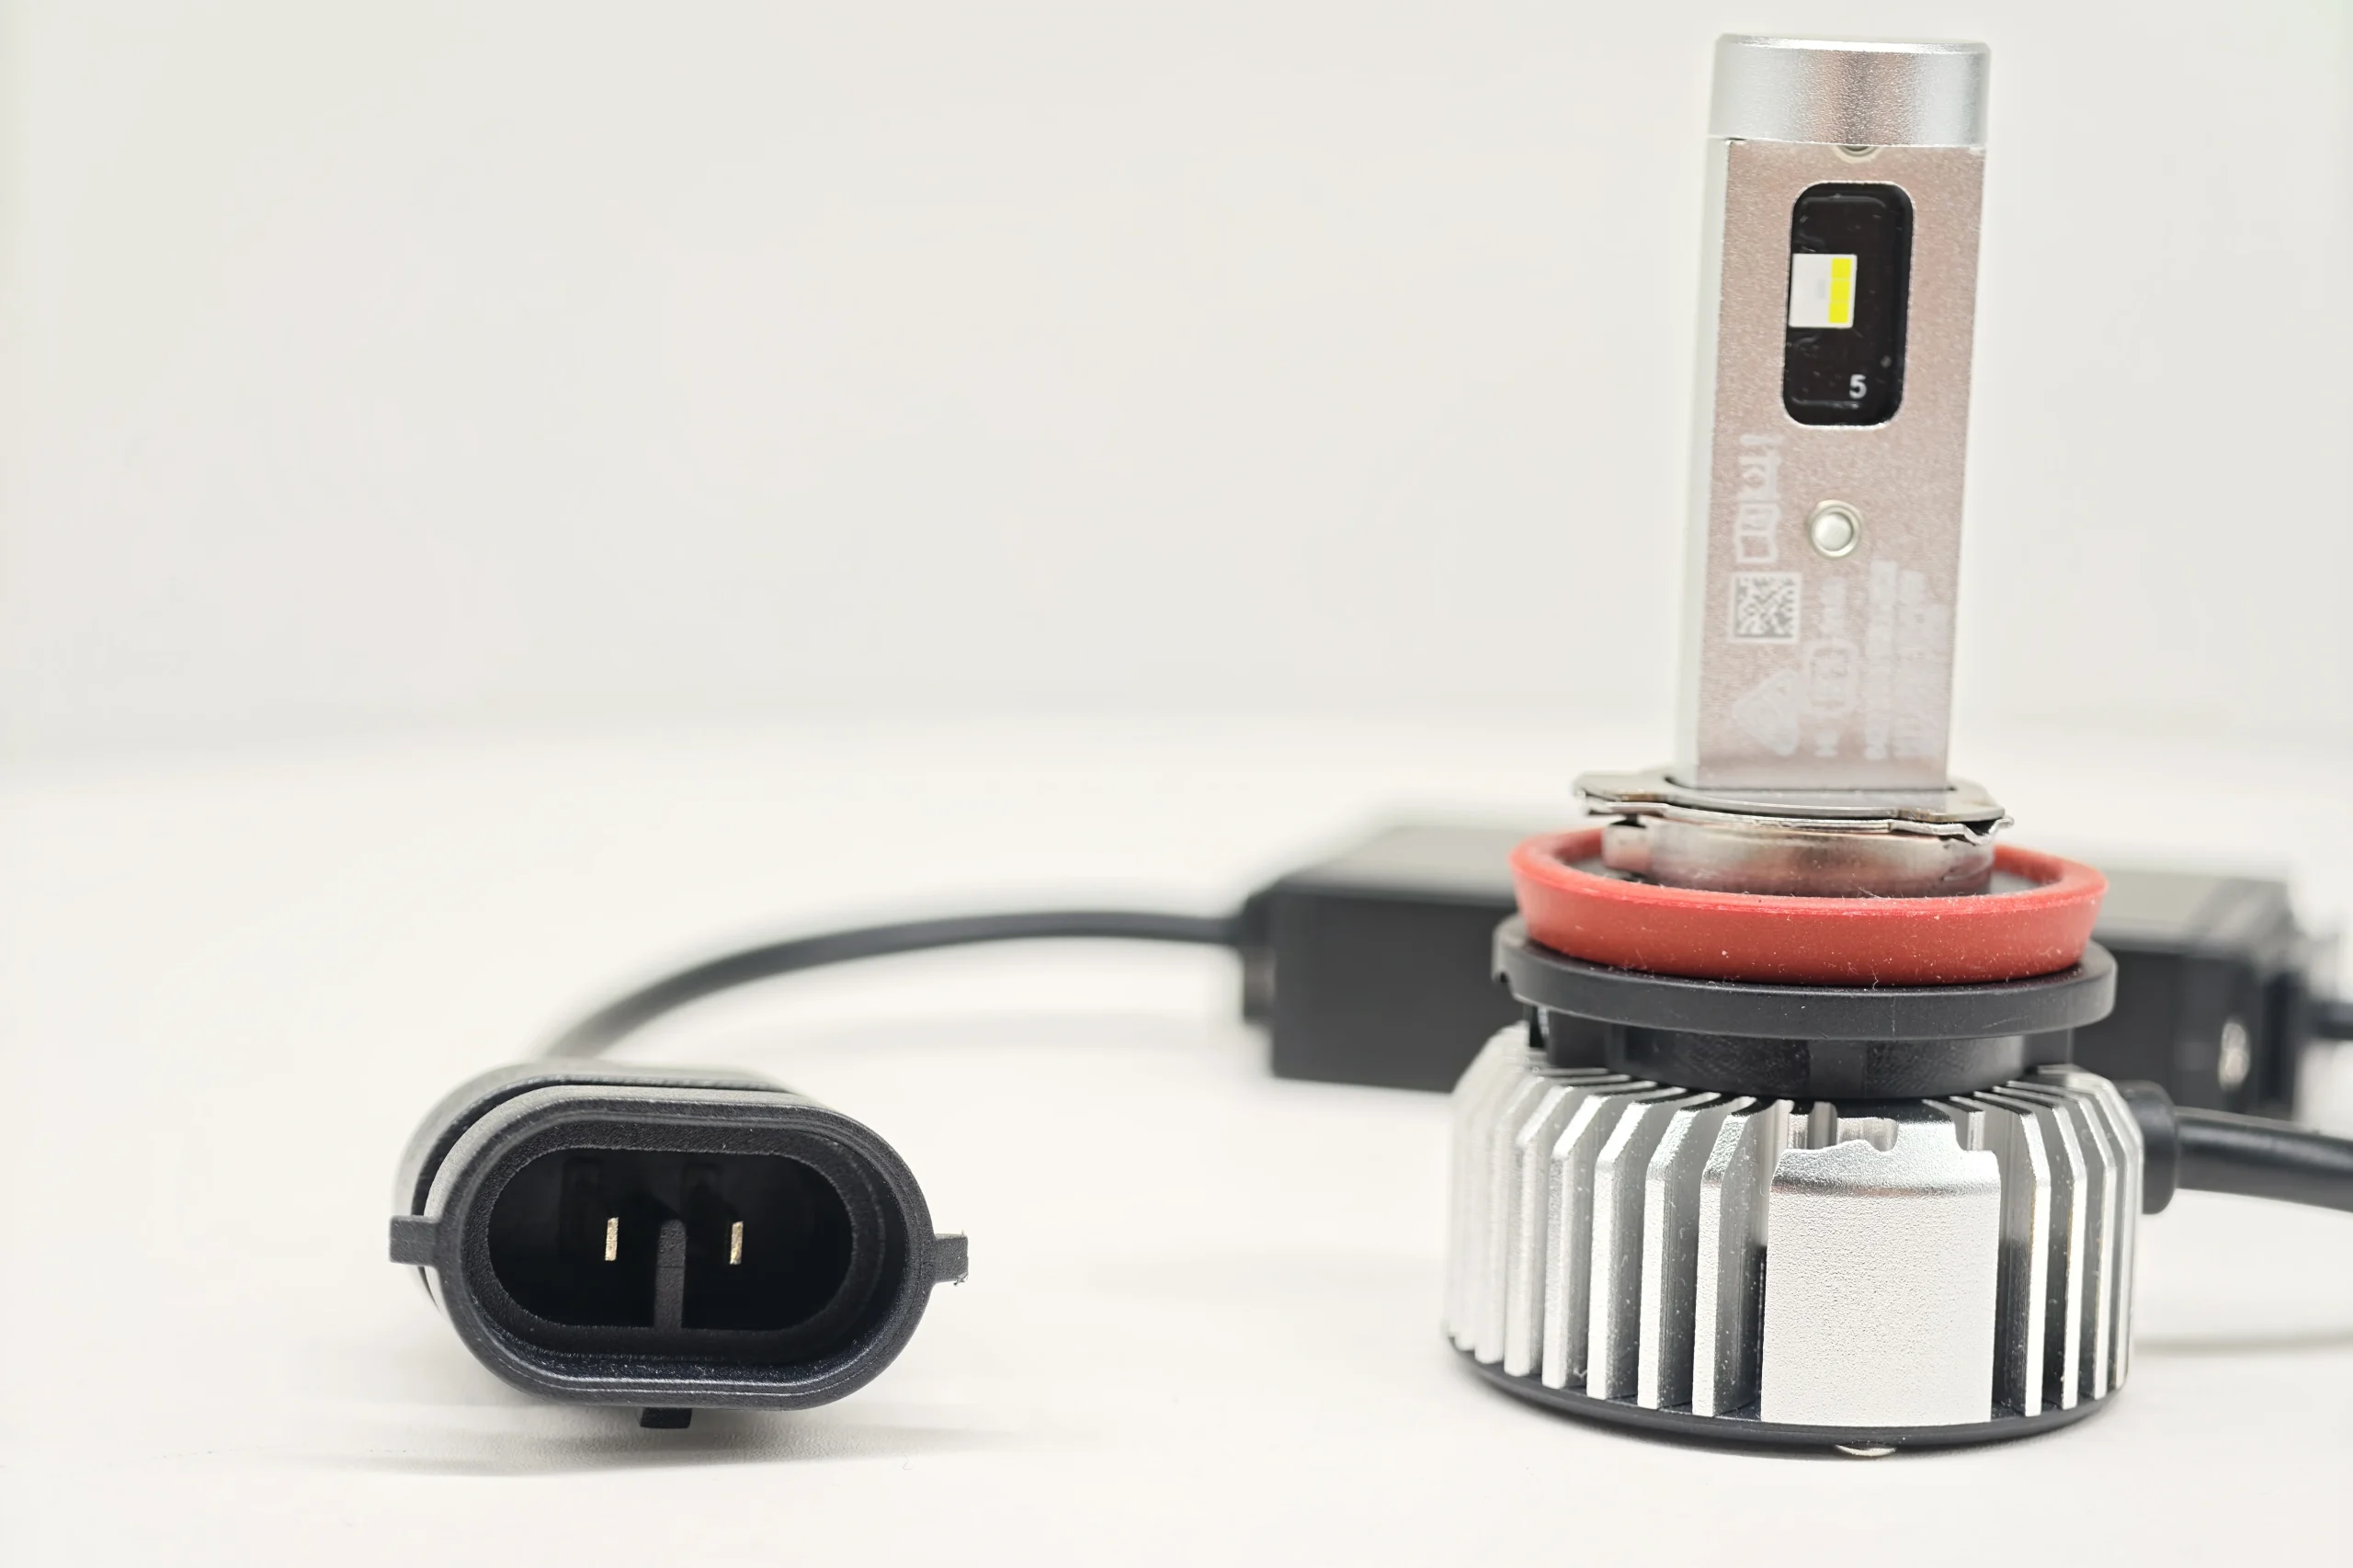
Shared structure: Both samples use a keyed, oval two-pin H11 connector with a central divider.
PGJ19-2 base and locating features
The top views show the PGJ19-2 mounting structure of each sample.
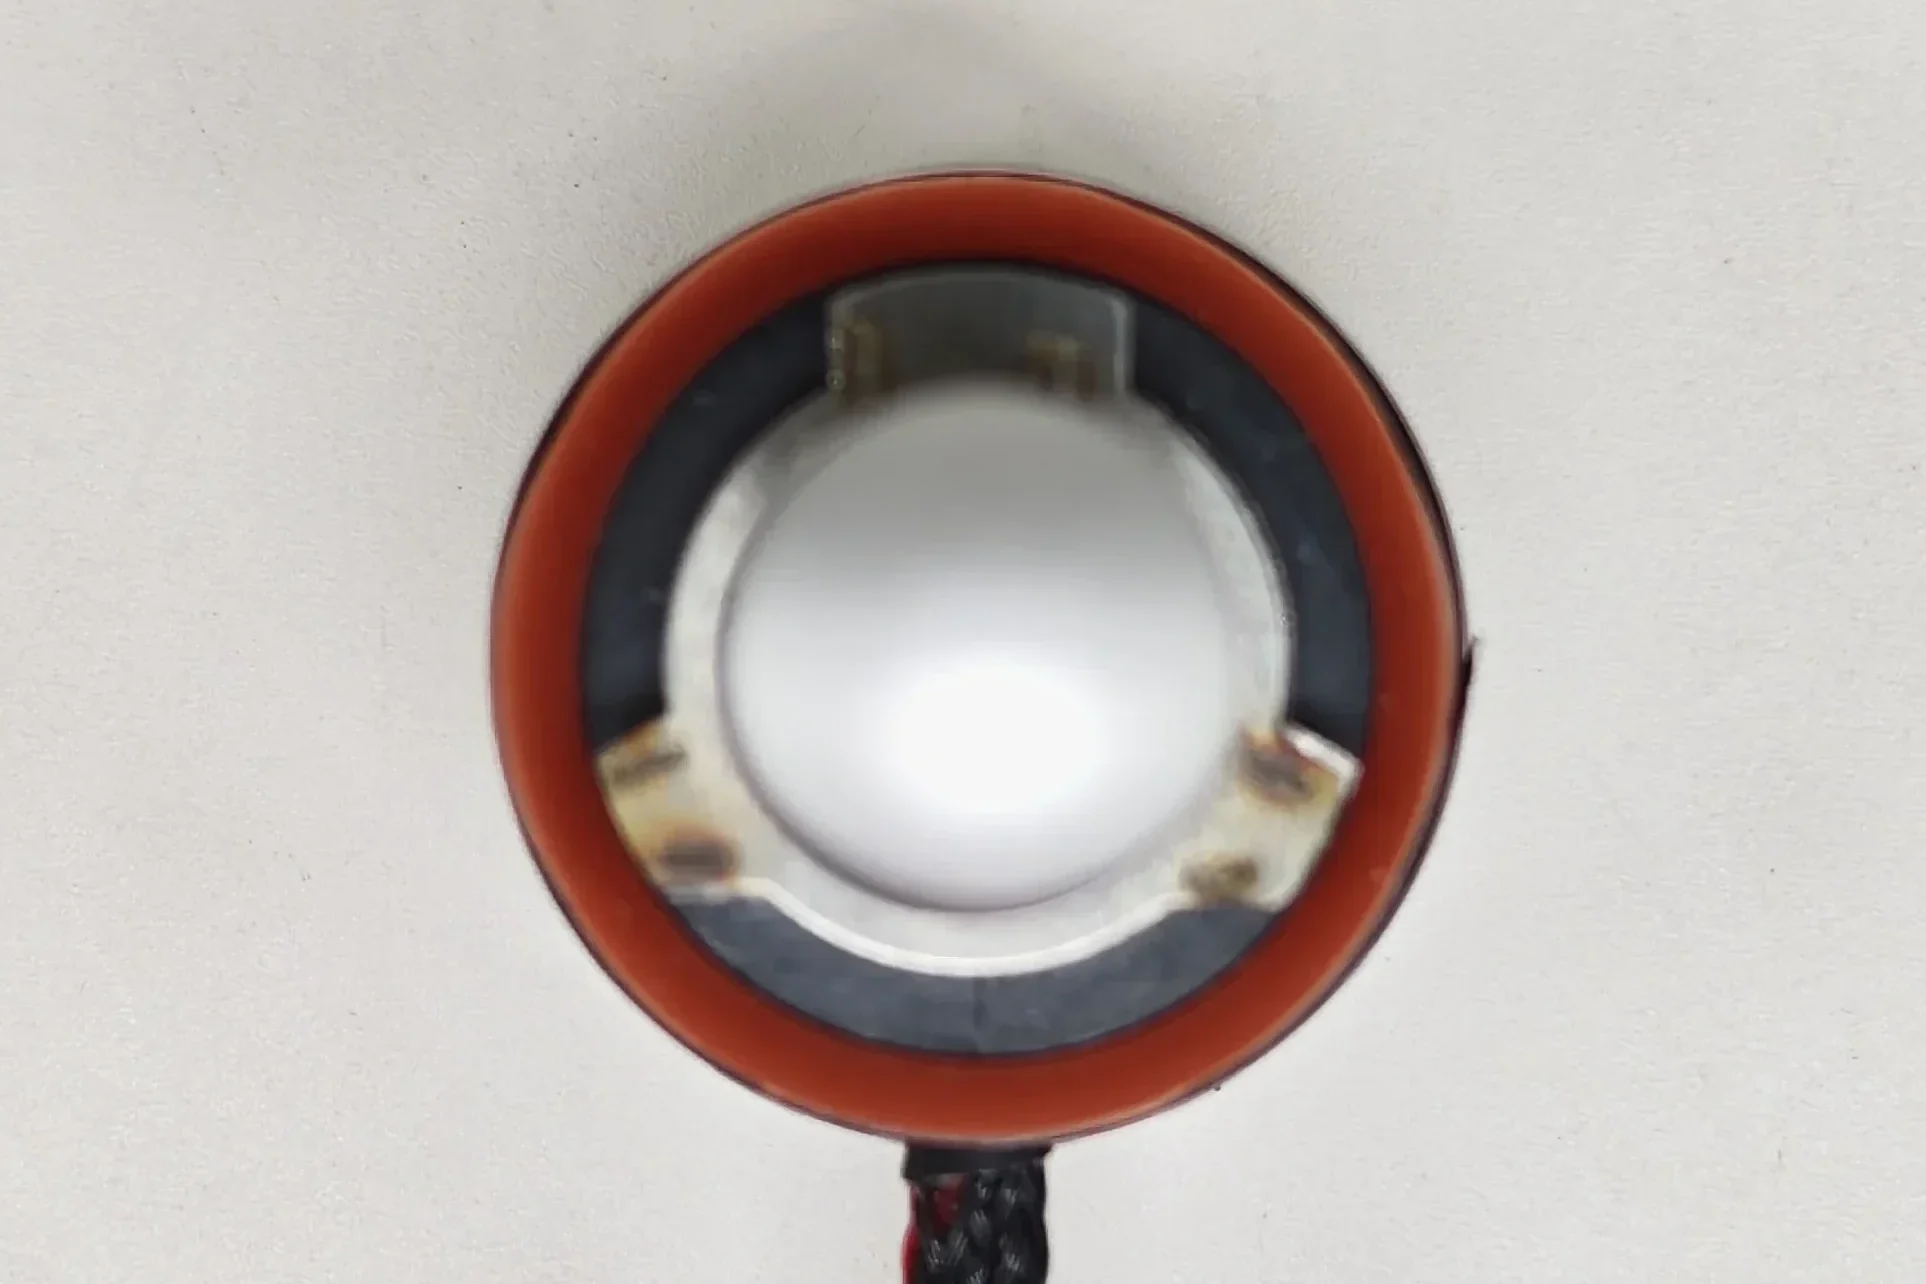
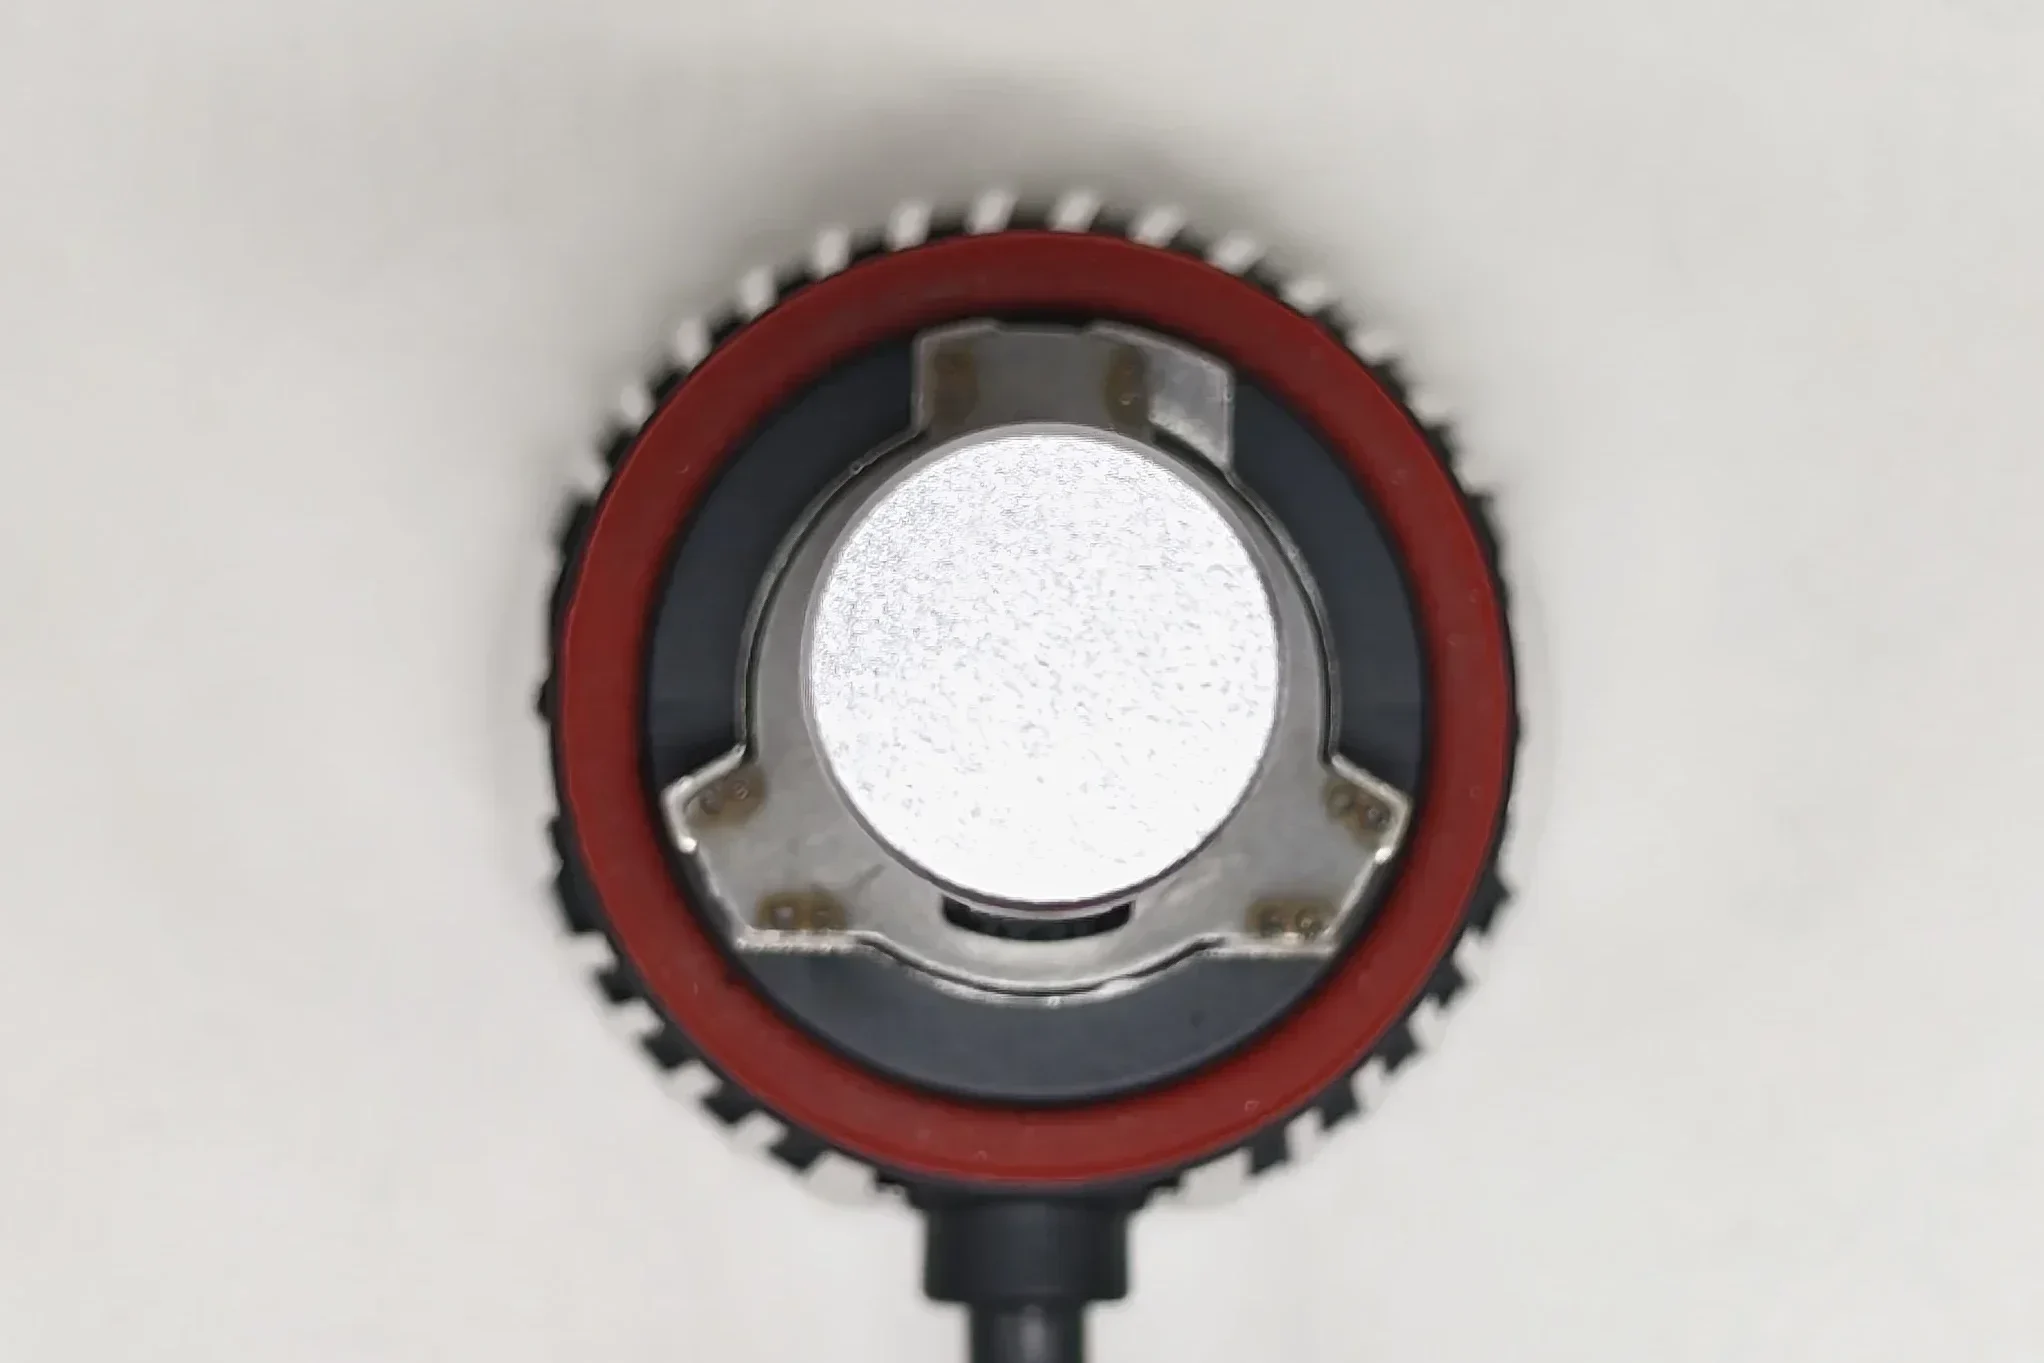
Shared structure: Both samples use the same keyed PGJ19-2 mounting structure, with asymmetric metal locating tabs and a red sealing ring.
Base installation-section measurement
The caliper readings compare the diameters of the two base installation sections.
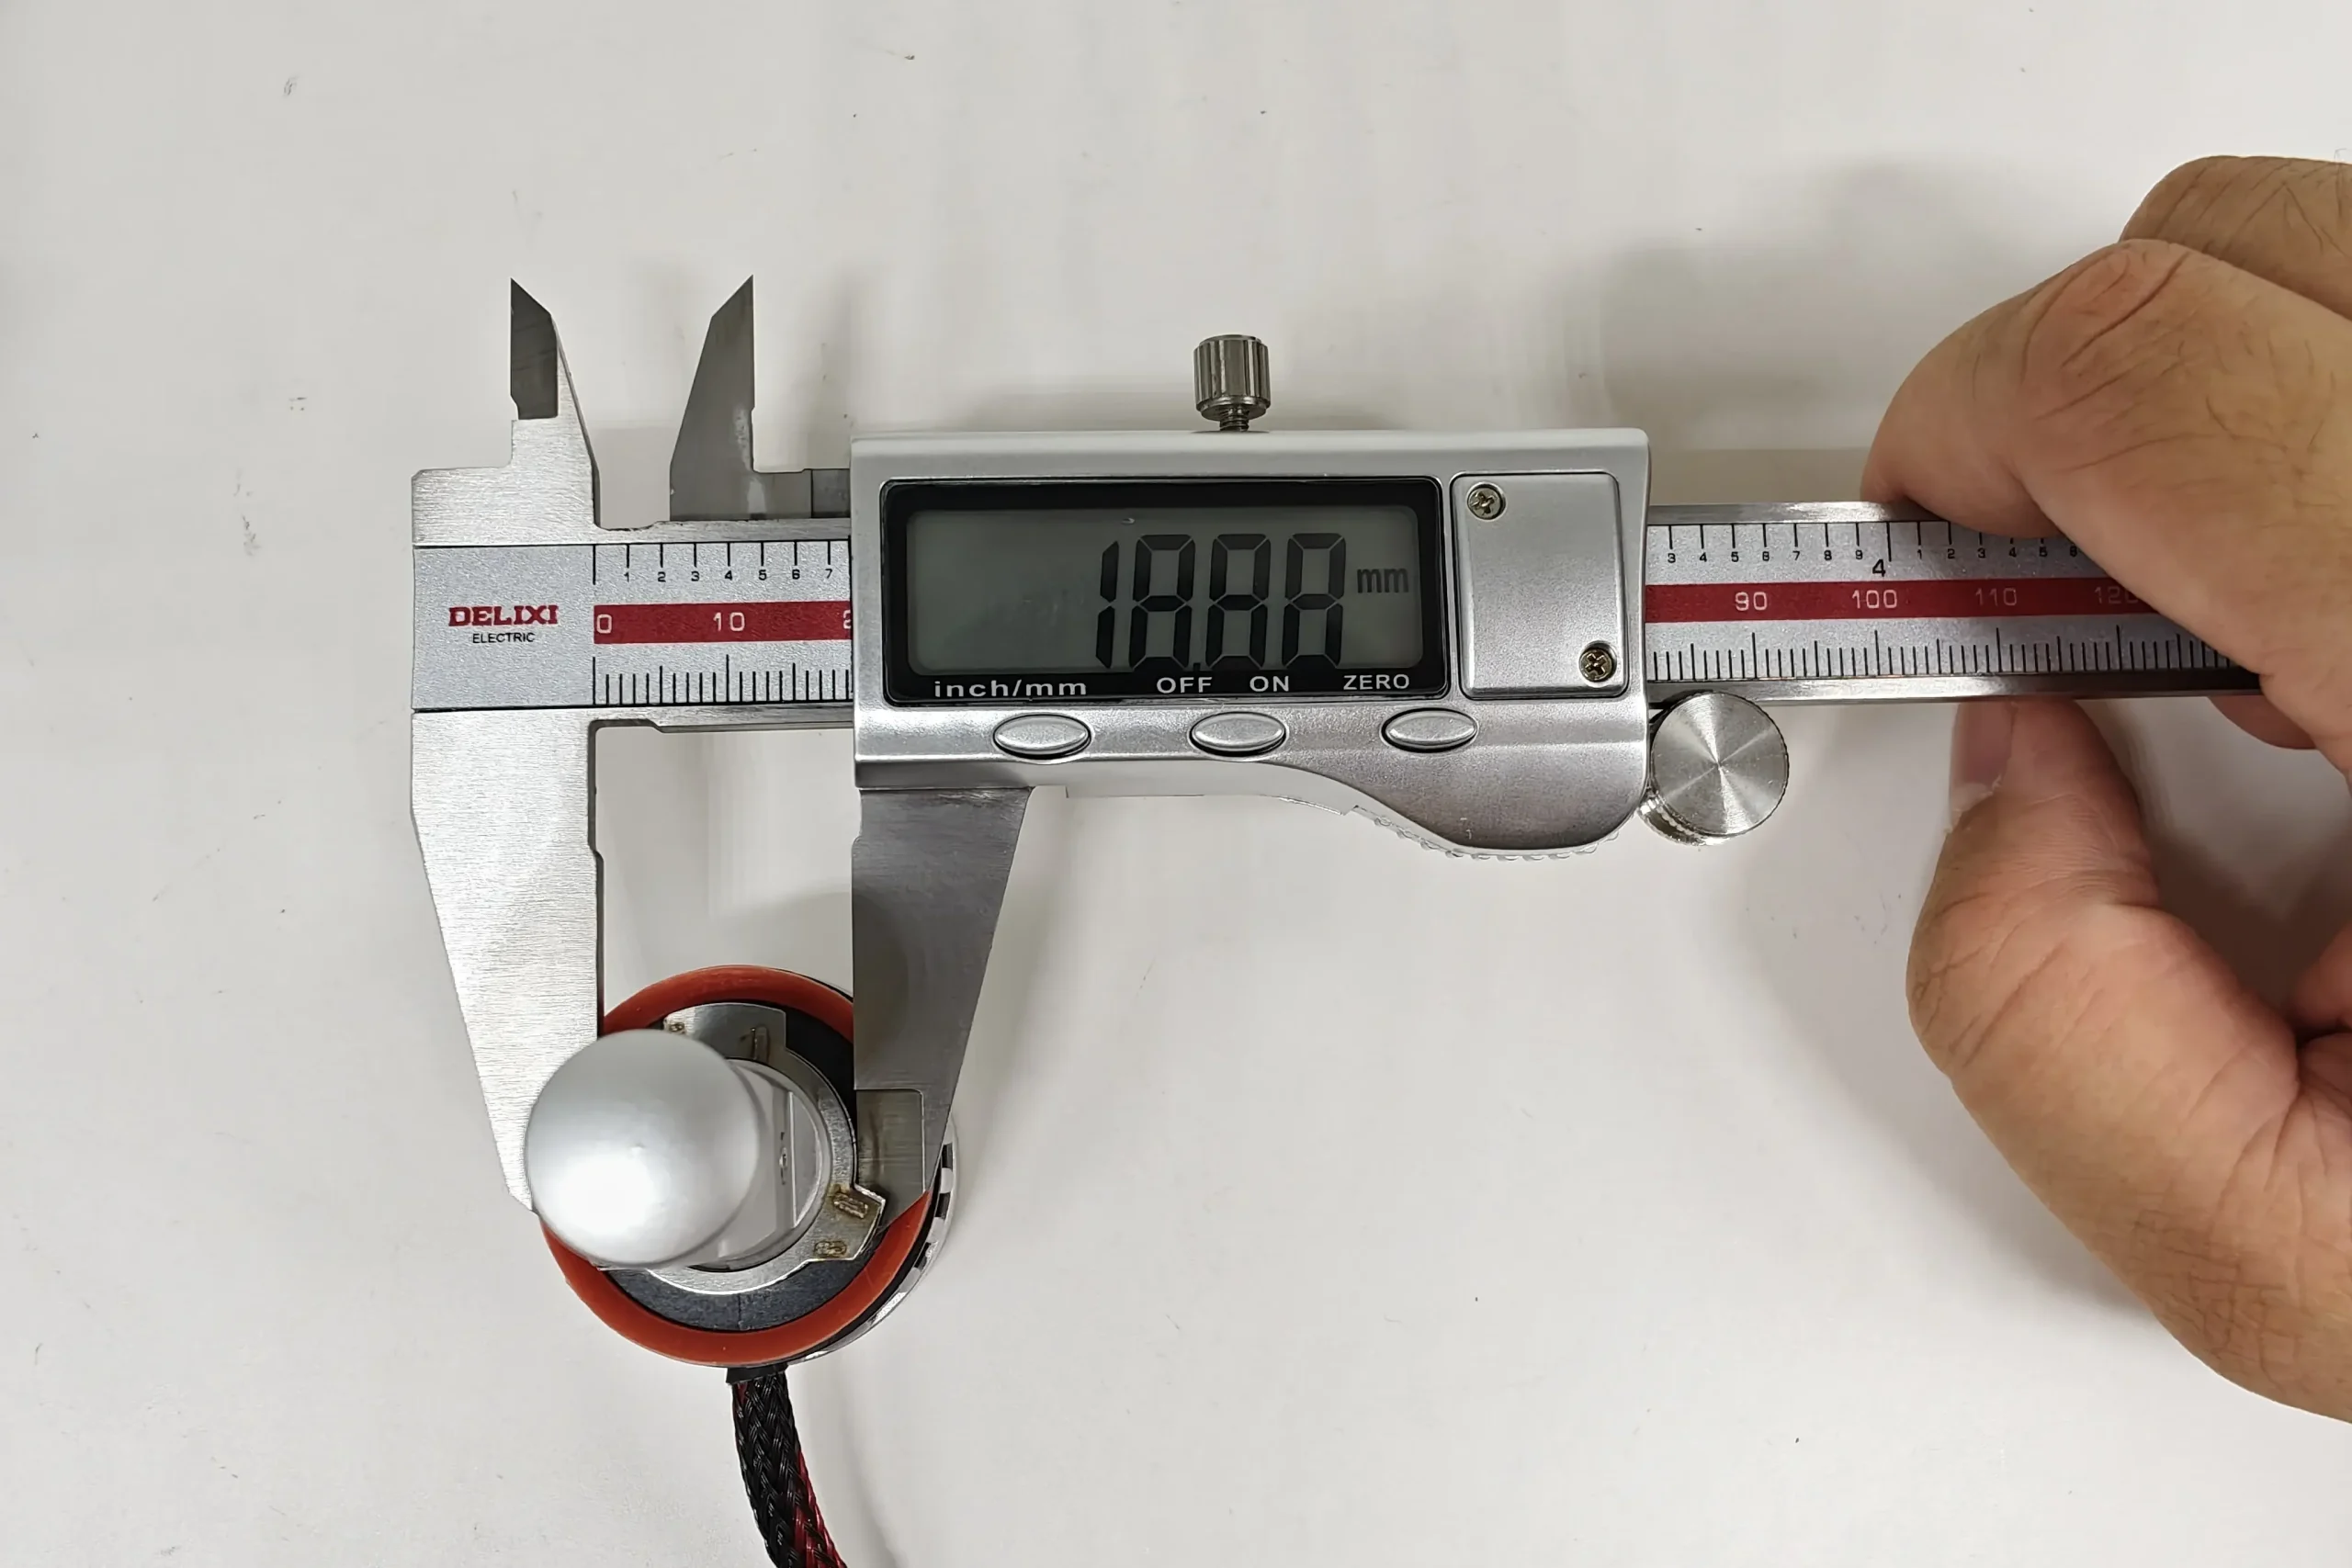
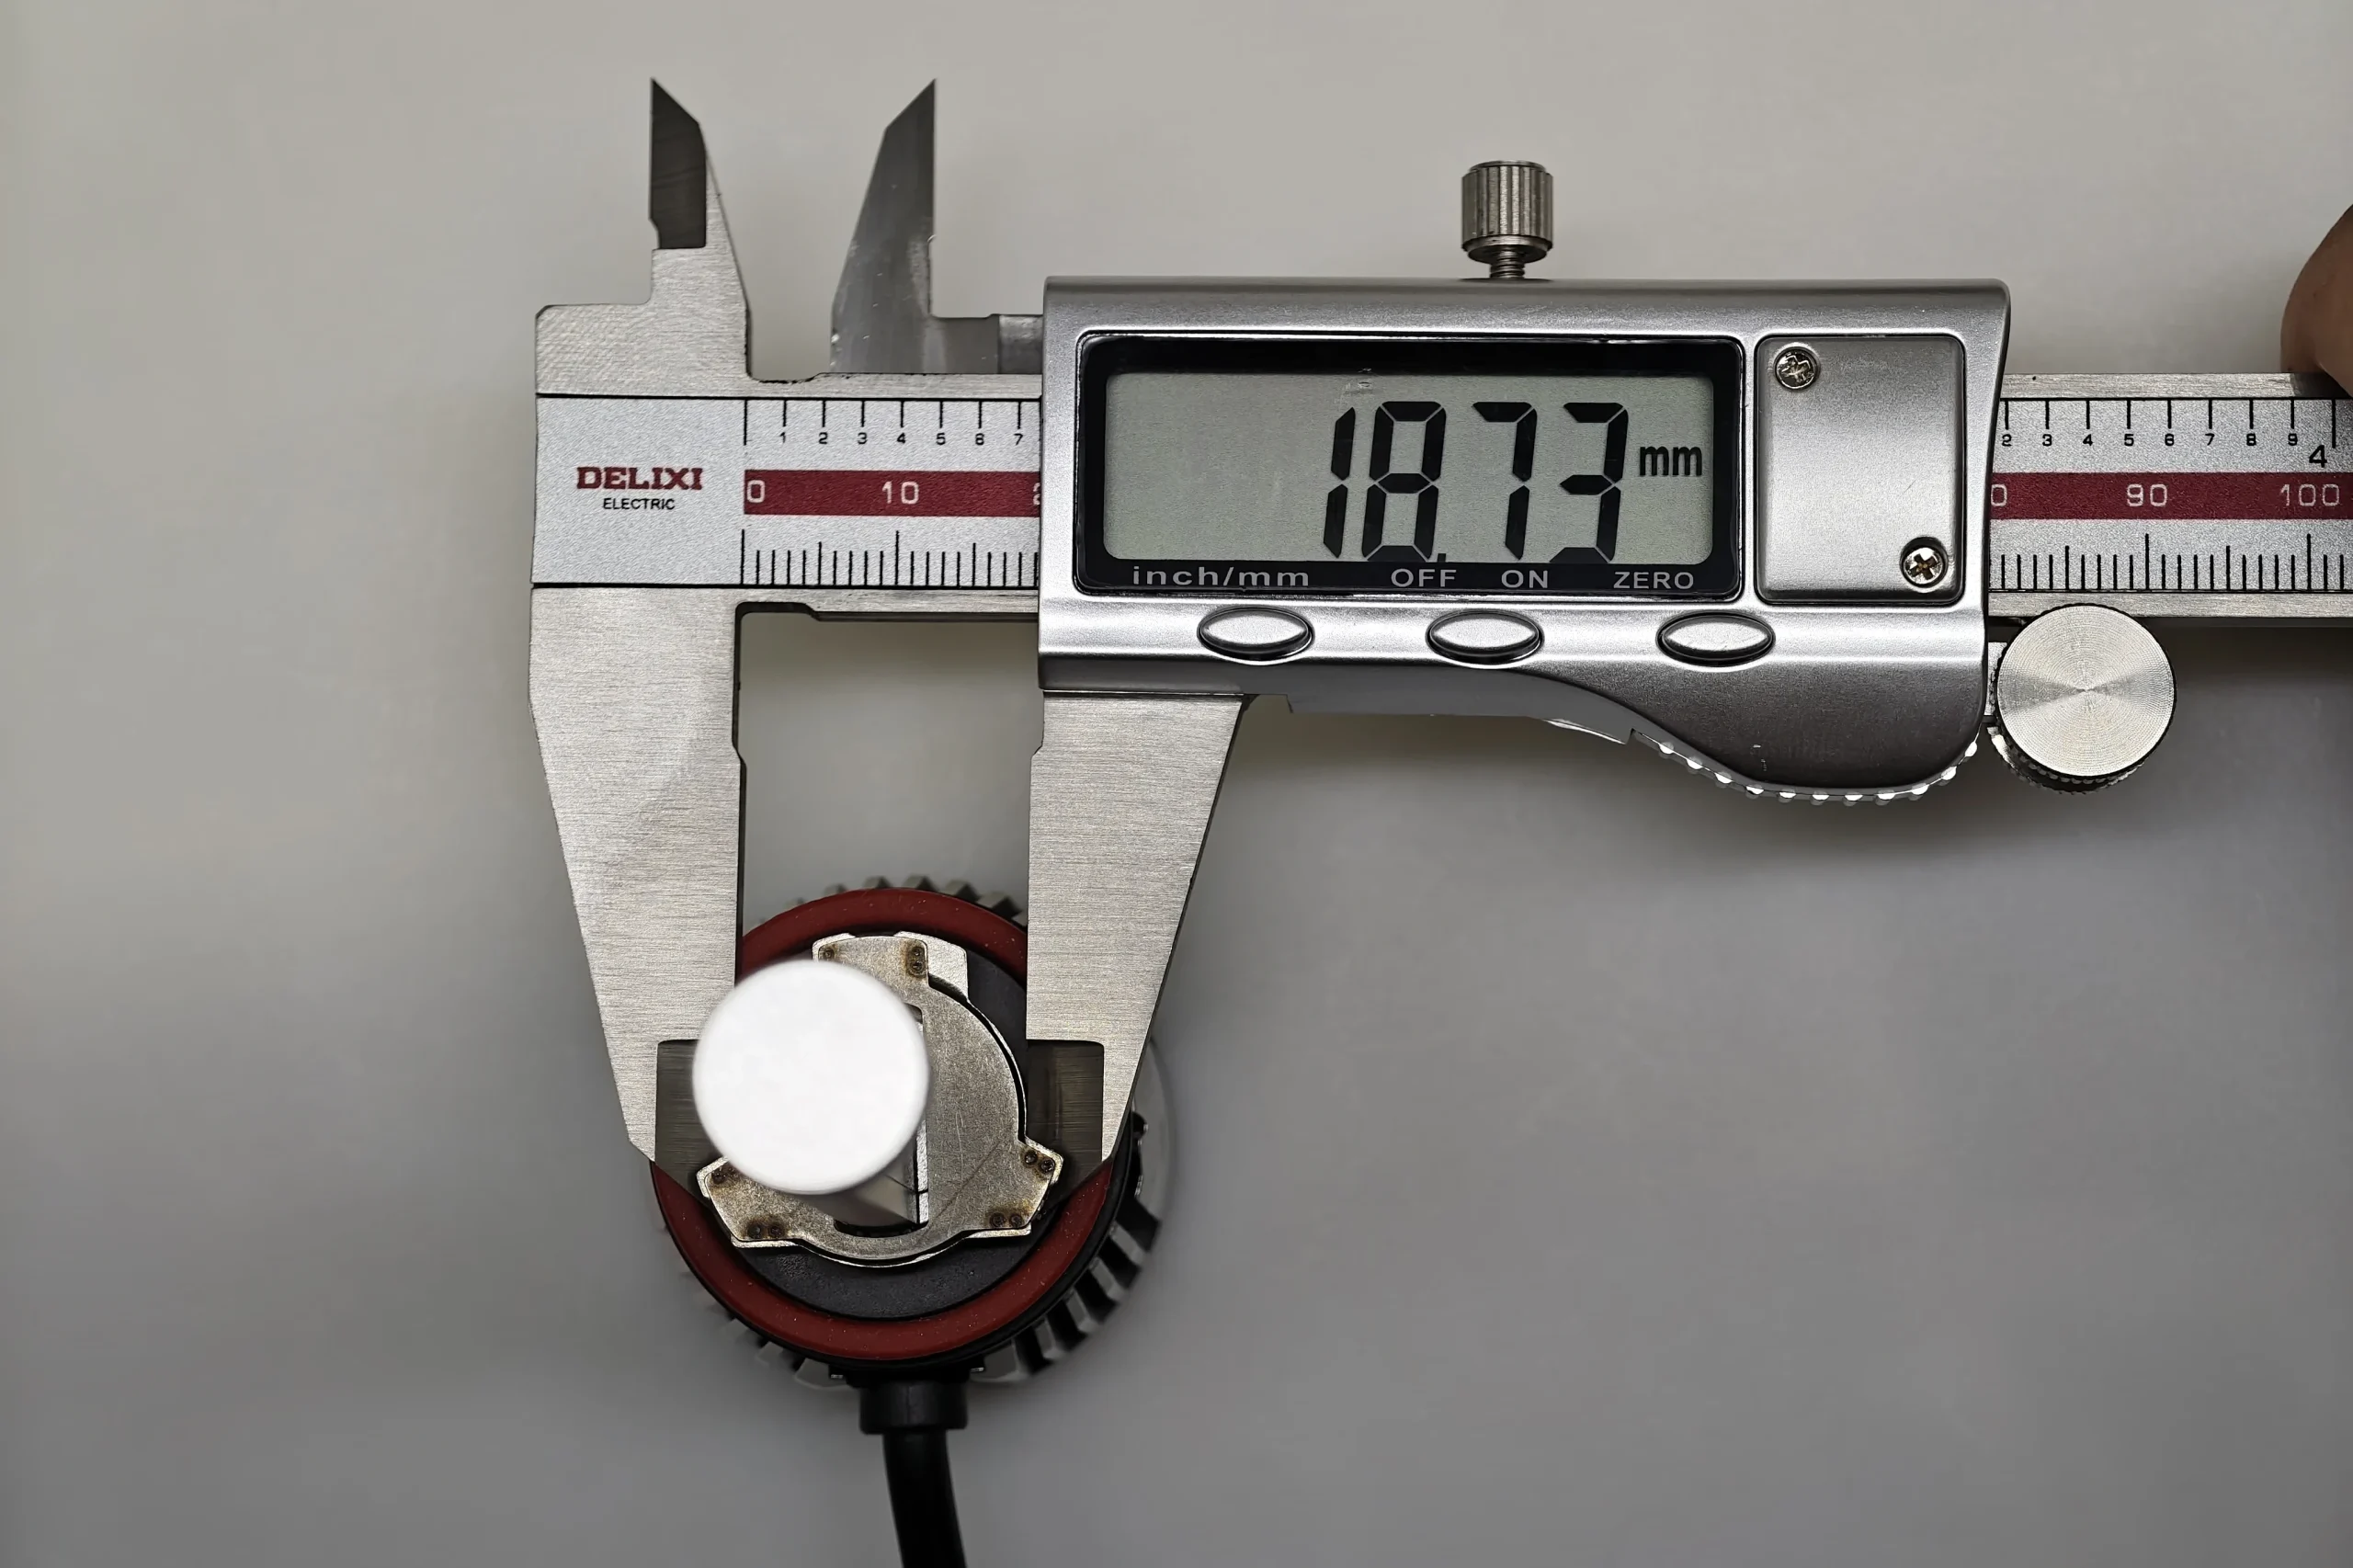
Installation-section diameter: EB measures 18.88 mm and OSRAM 18.73 mm—a difference of 0.15 mm, with EB measuring 0.80% larger.
Metal retaining spring
This metal retaining spring stabilises the lamp’s axial and rotational position, helping maintain the LED emitting surfaces in the intended optical reference position.
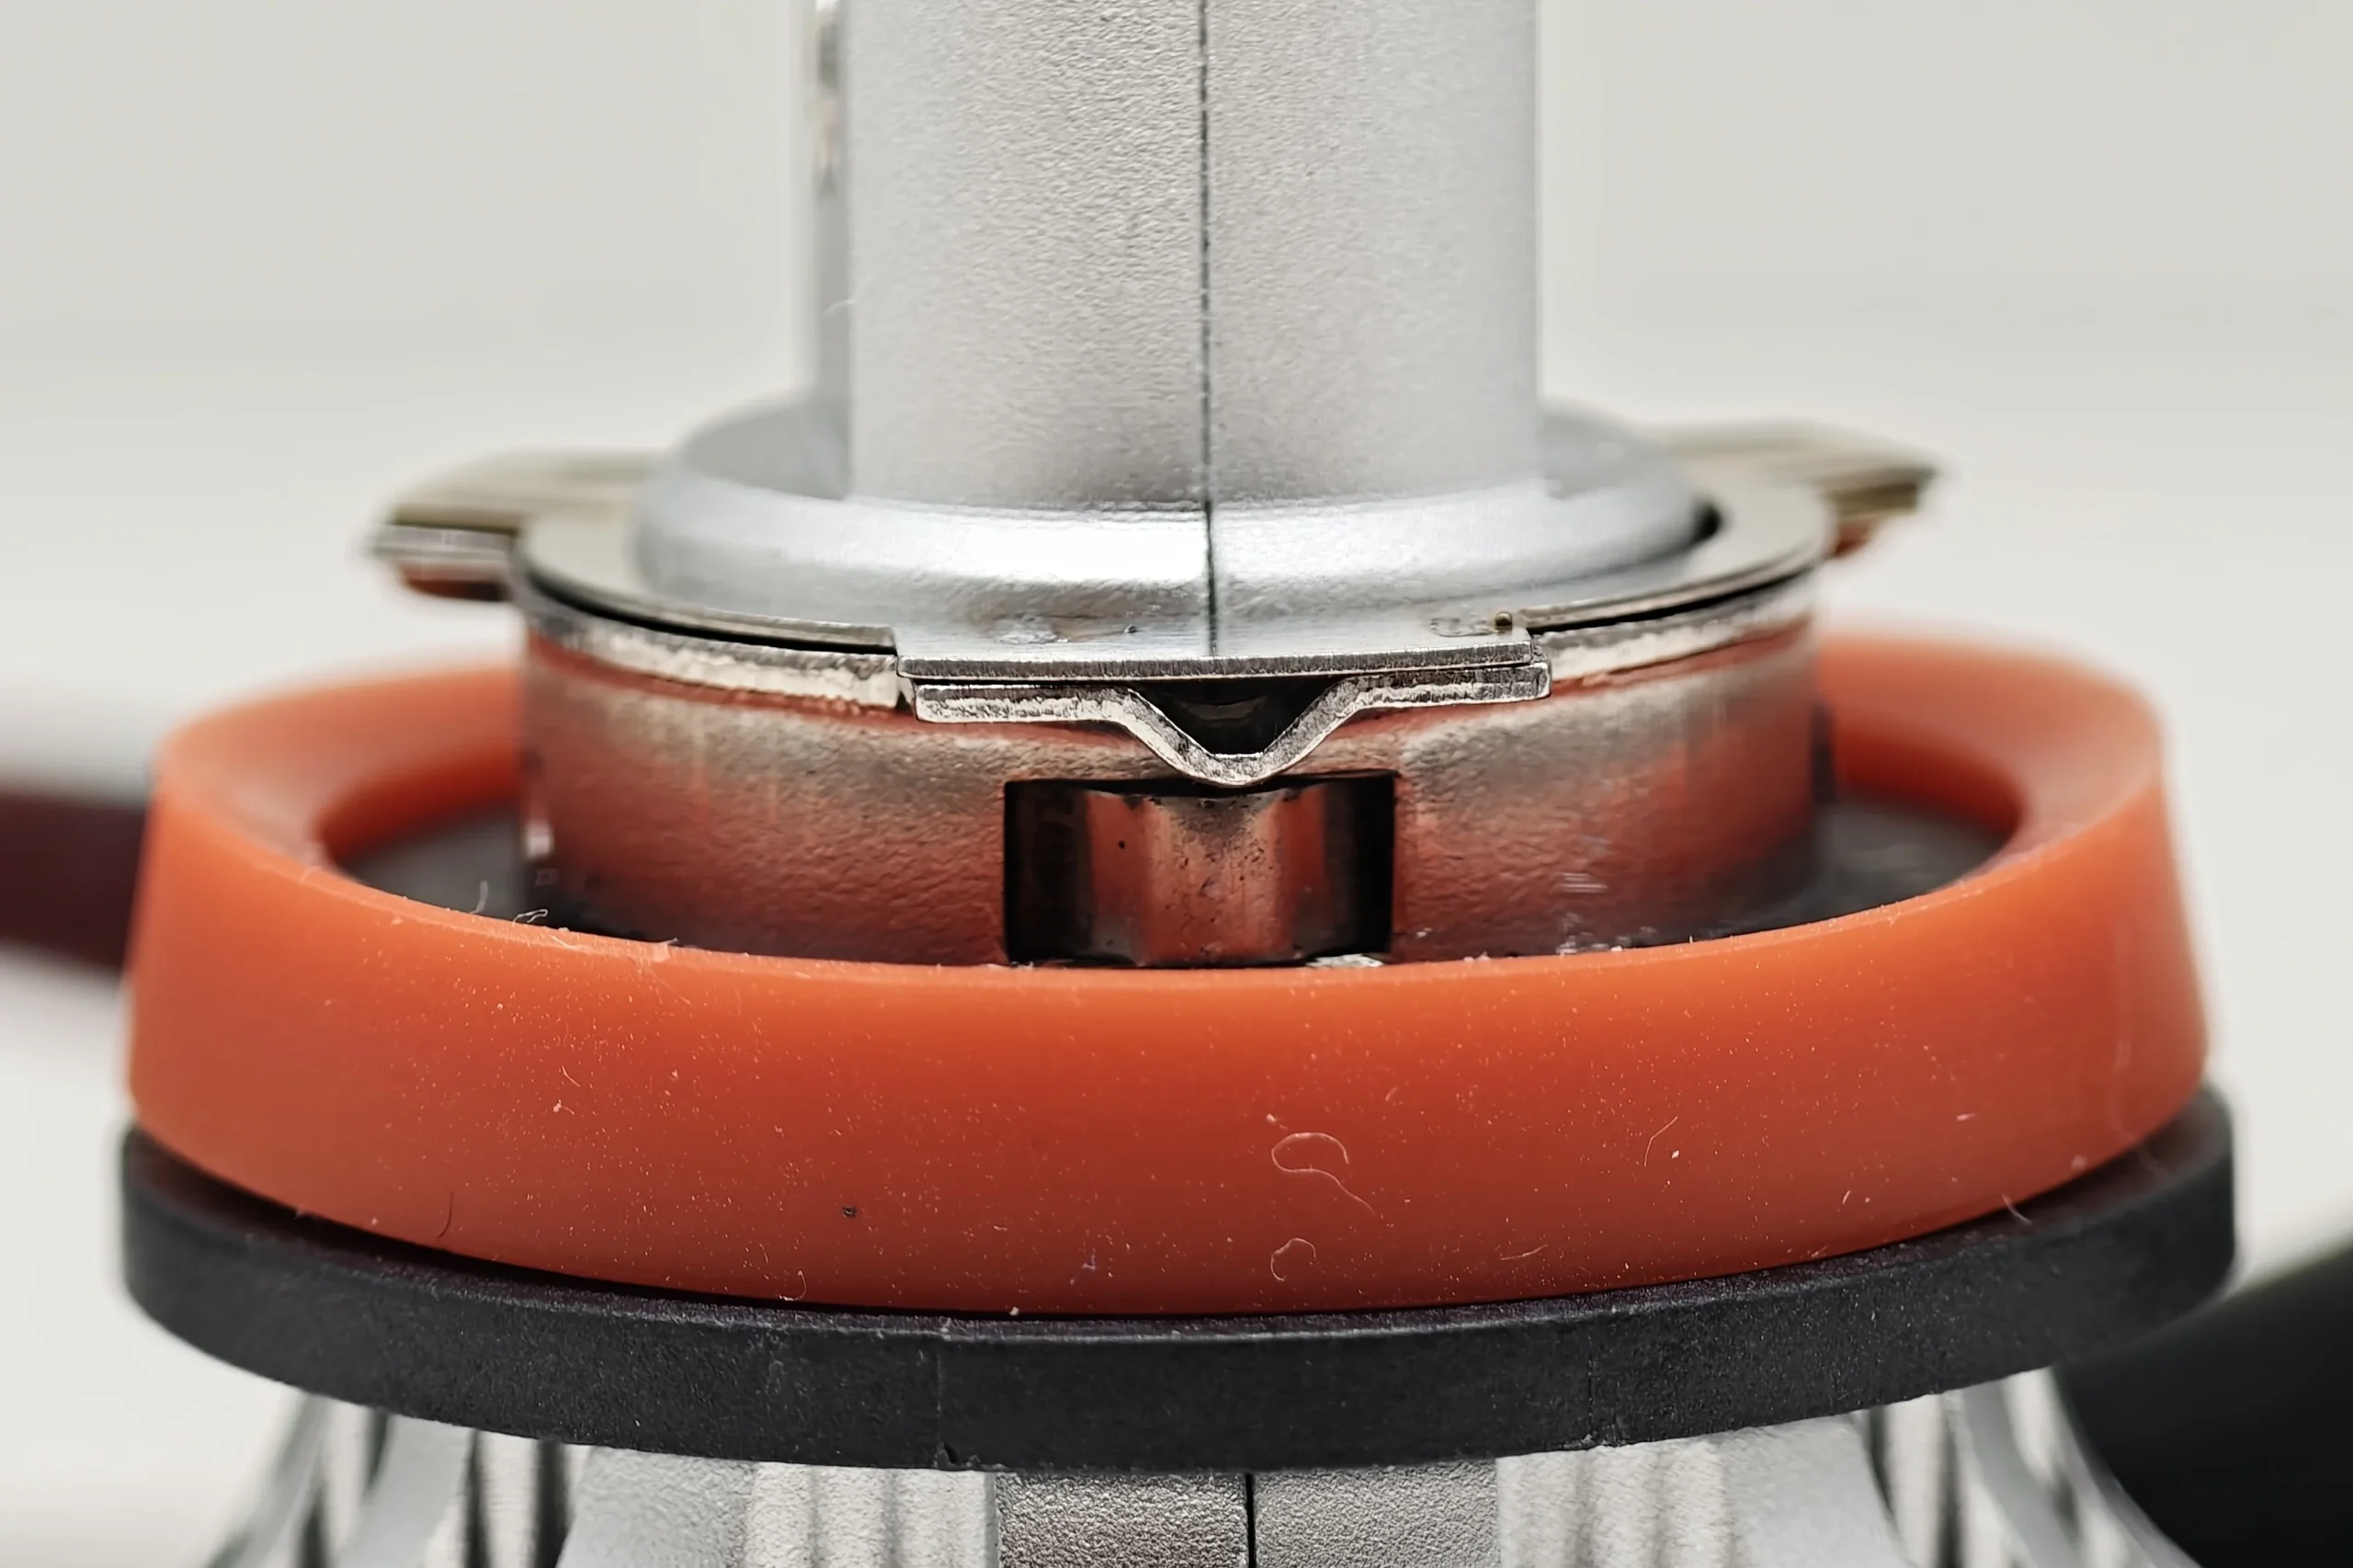
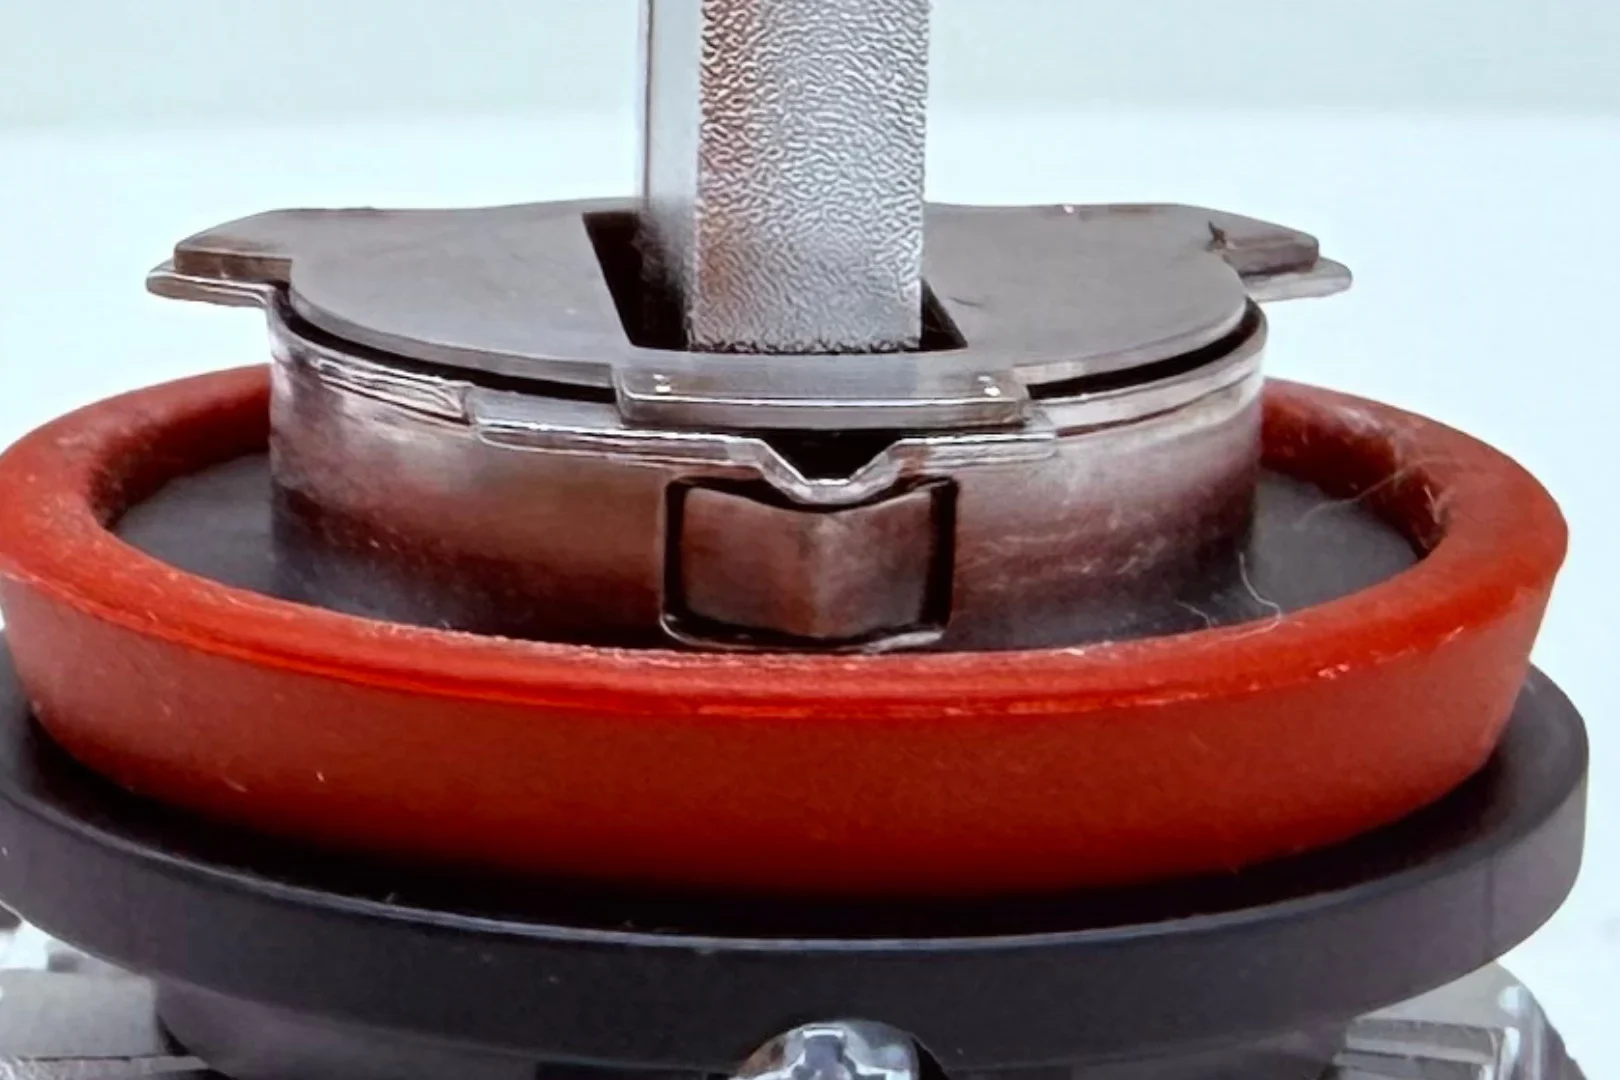
Both samples incorporate a metal retaining spring in the lamp base.
Lamp-Construction Comparison
| Item | EB | OSRAM | Difference |
|---|---|---|---|
| Installation-section diameter | 18.88 mm | 18.73 mm | EB is 0.15 mm larger |
| Rear heat sink | Cylindrical | Radial-finned | Different geometry |
| Cable | Braided | Smooth black | Different construction |
| External driver | Narrow and elongated | Broad and rectangular | Different proportions |
| Metal retaining spring | Present | Present | / |
Conclusion and recommendation: Both samples use the same basic H11 mounting arrangement, including a metal retaining spring, and their installation-section diameters differ by only 0.15 mm. The main construction differences are the rear heat sink, cable and external-driver housing. Buyers should therefore verify and record the dimensions of these rear components when preparing product specifications or evaluating installation-space requirements.
3.LED emitting structure and Box system
Comparison focus: This section compares the visible emitting-area geometry, the distance between opposing LED emitting surfaces and their positions within the Box system. The applicable category requirements are available in the official UNECE UN Regulation No. 37 materials.
LED emitting-surface close-up
The close-ups compare the shape and arrangement of the visible LED emitting areas.
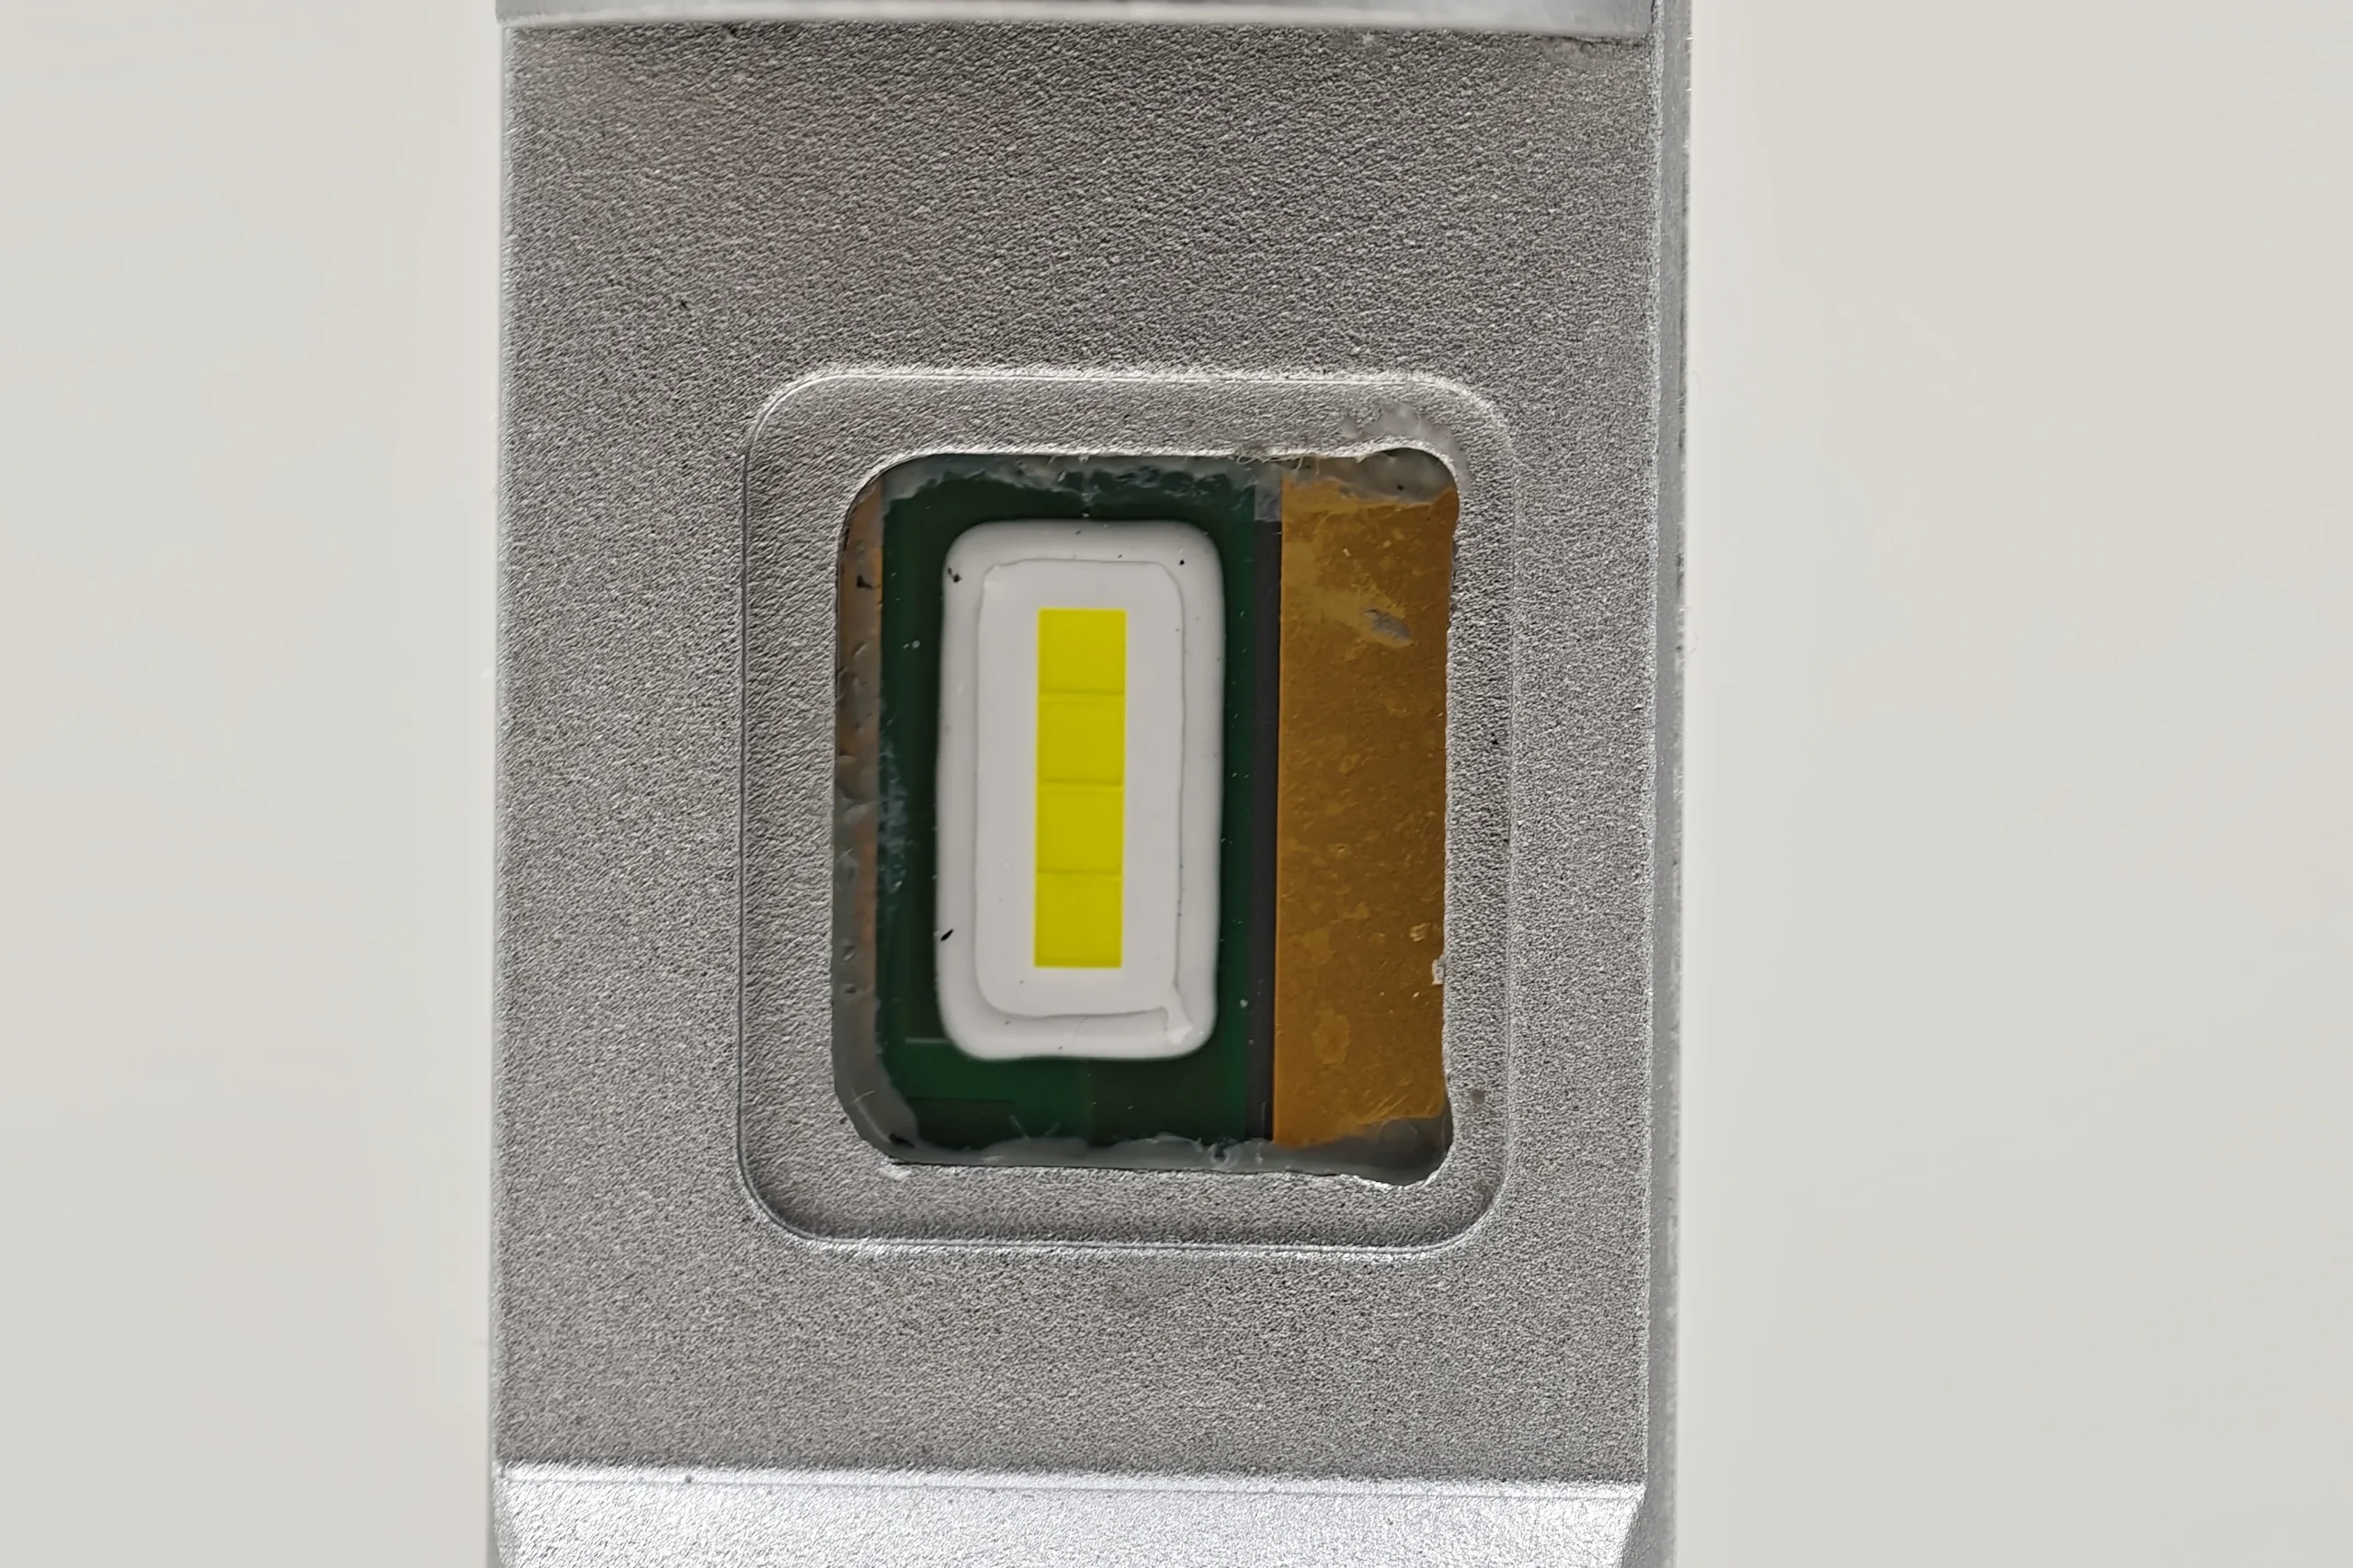
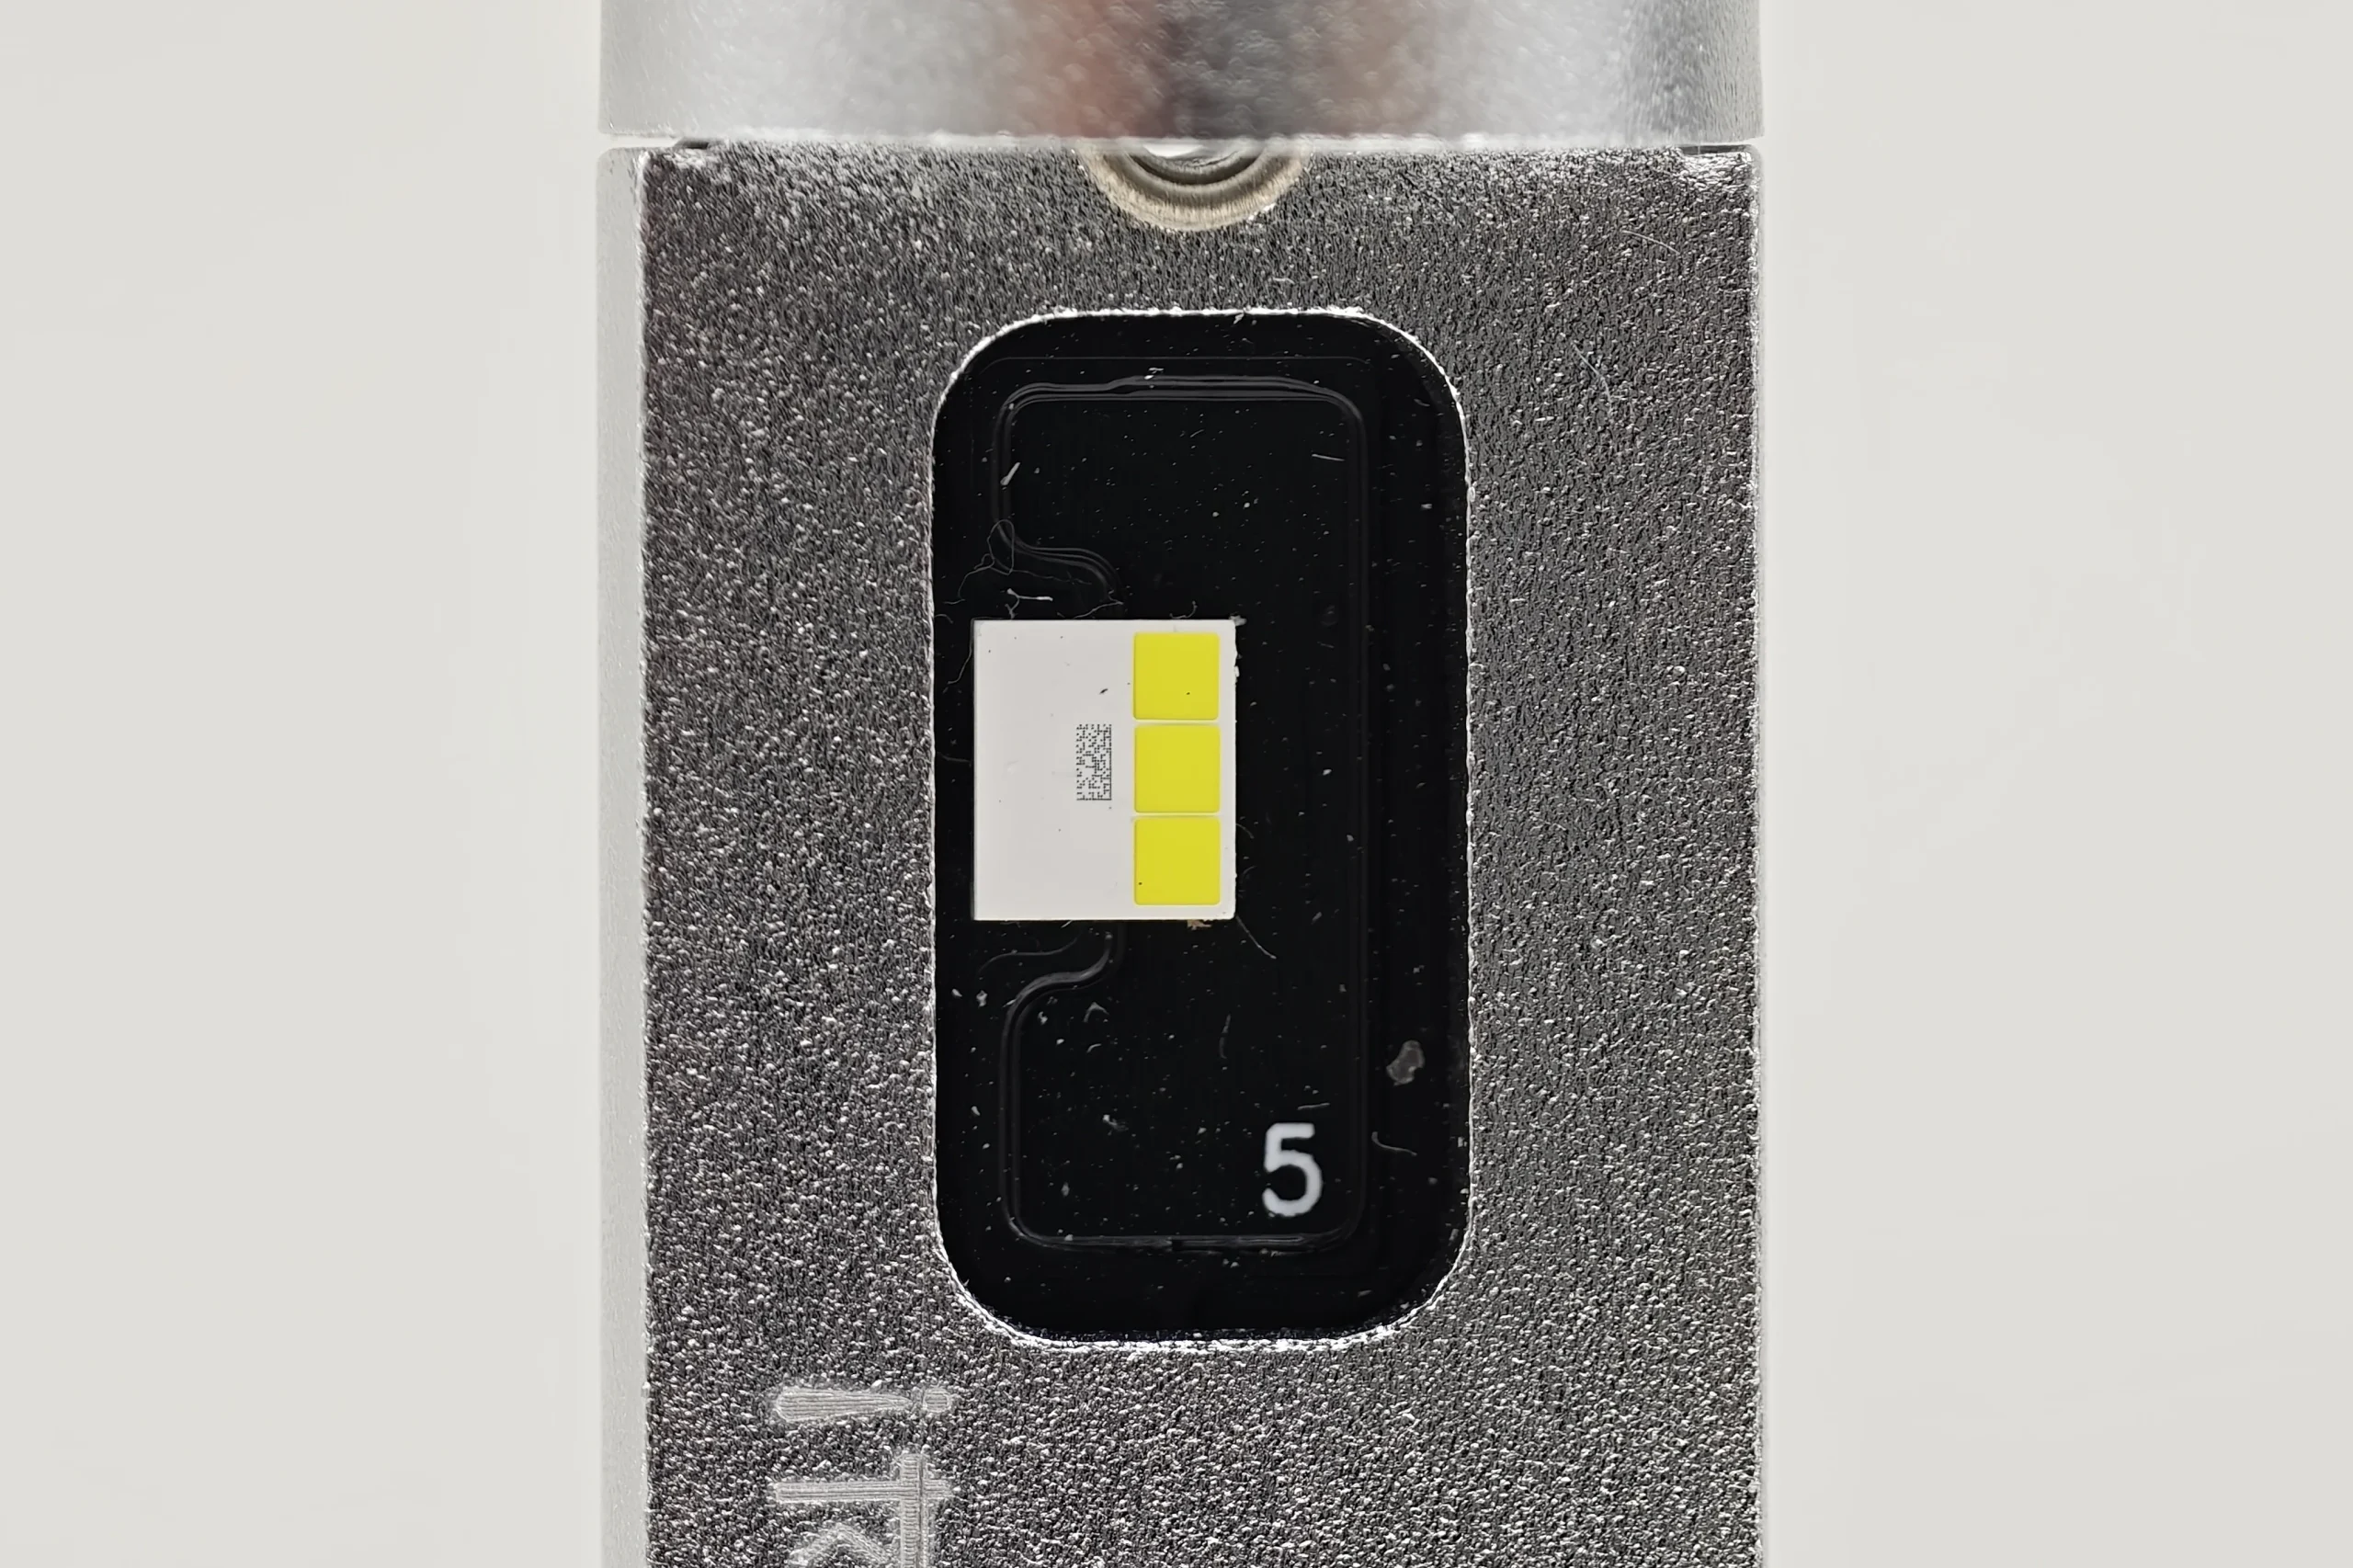
Visible emitting areas: EB uses a continuous rectangular phosphor window, while OSRAM uses three separate rectangular segments.
Distance between opposing LED emitting surfaces
The measurements compare the distance between the two opposing LED emitting surfaces.
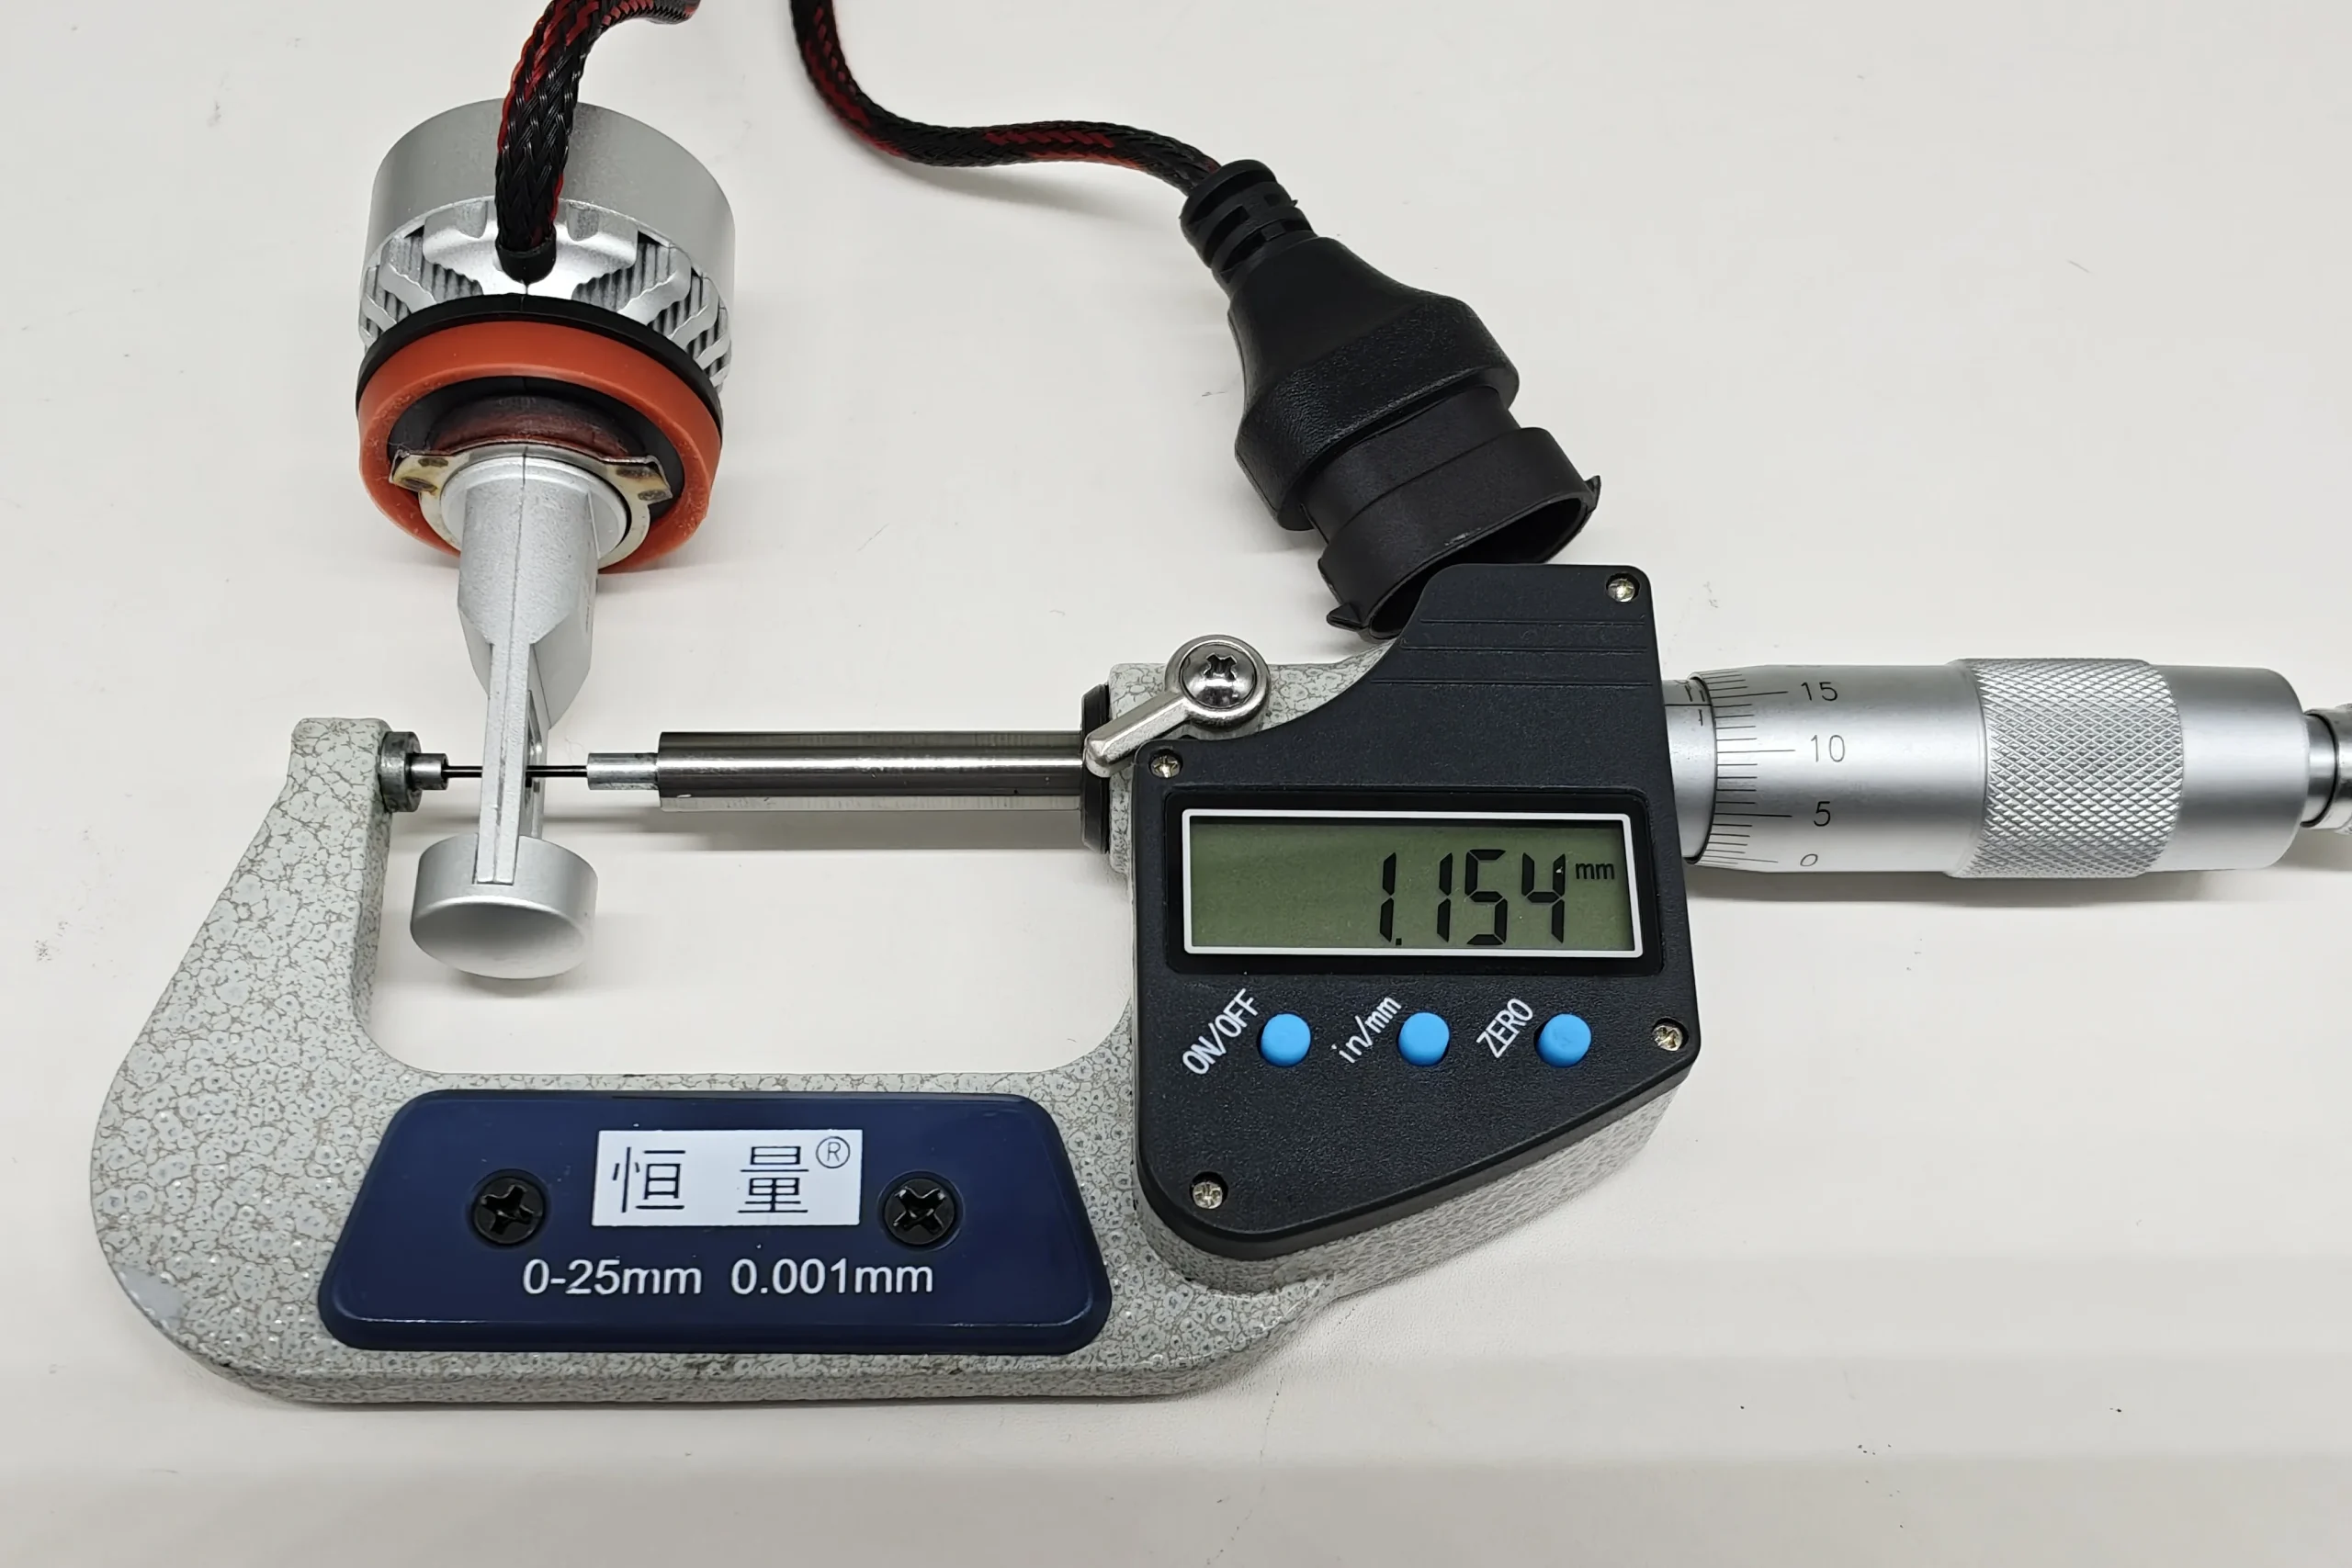
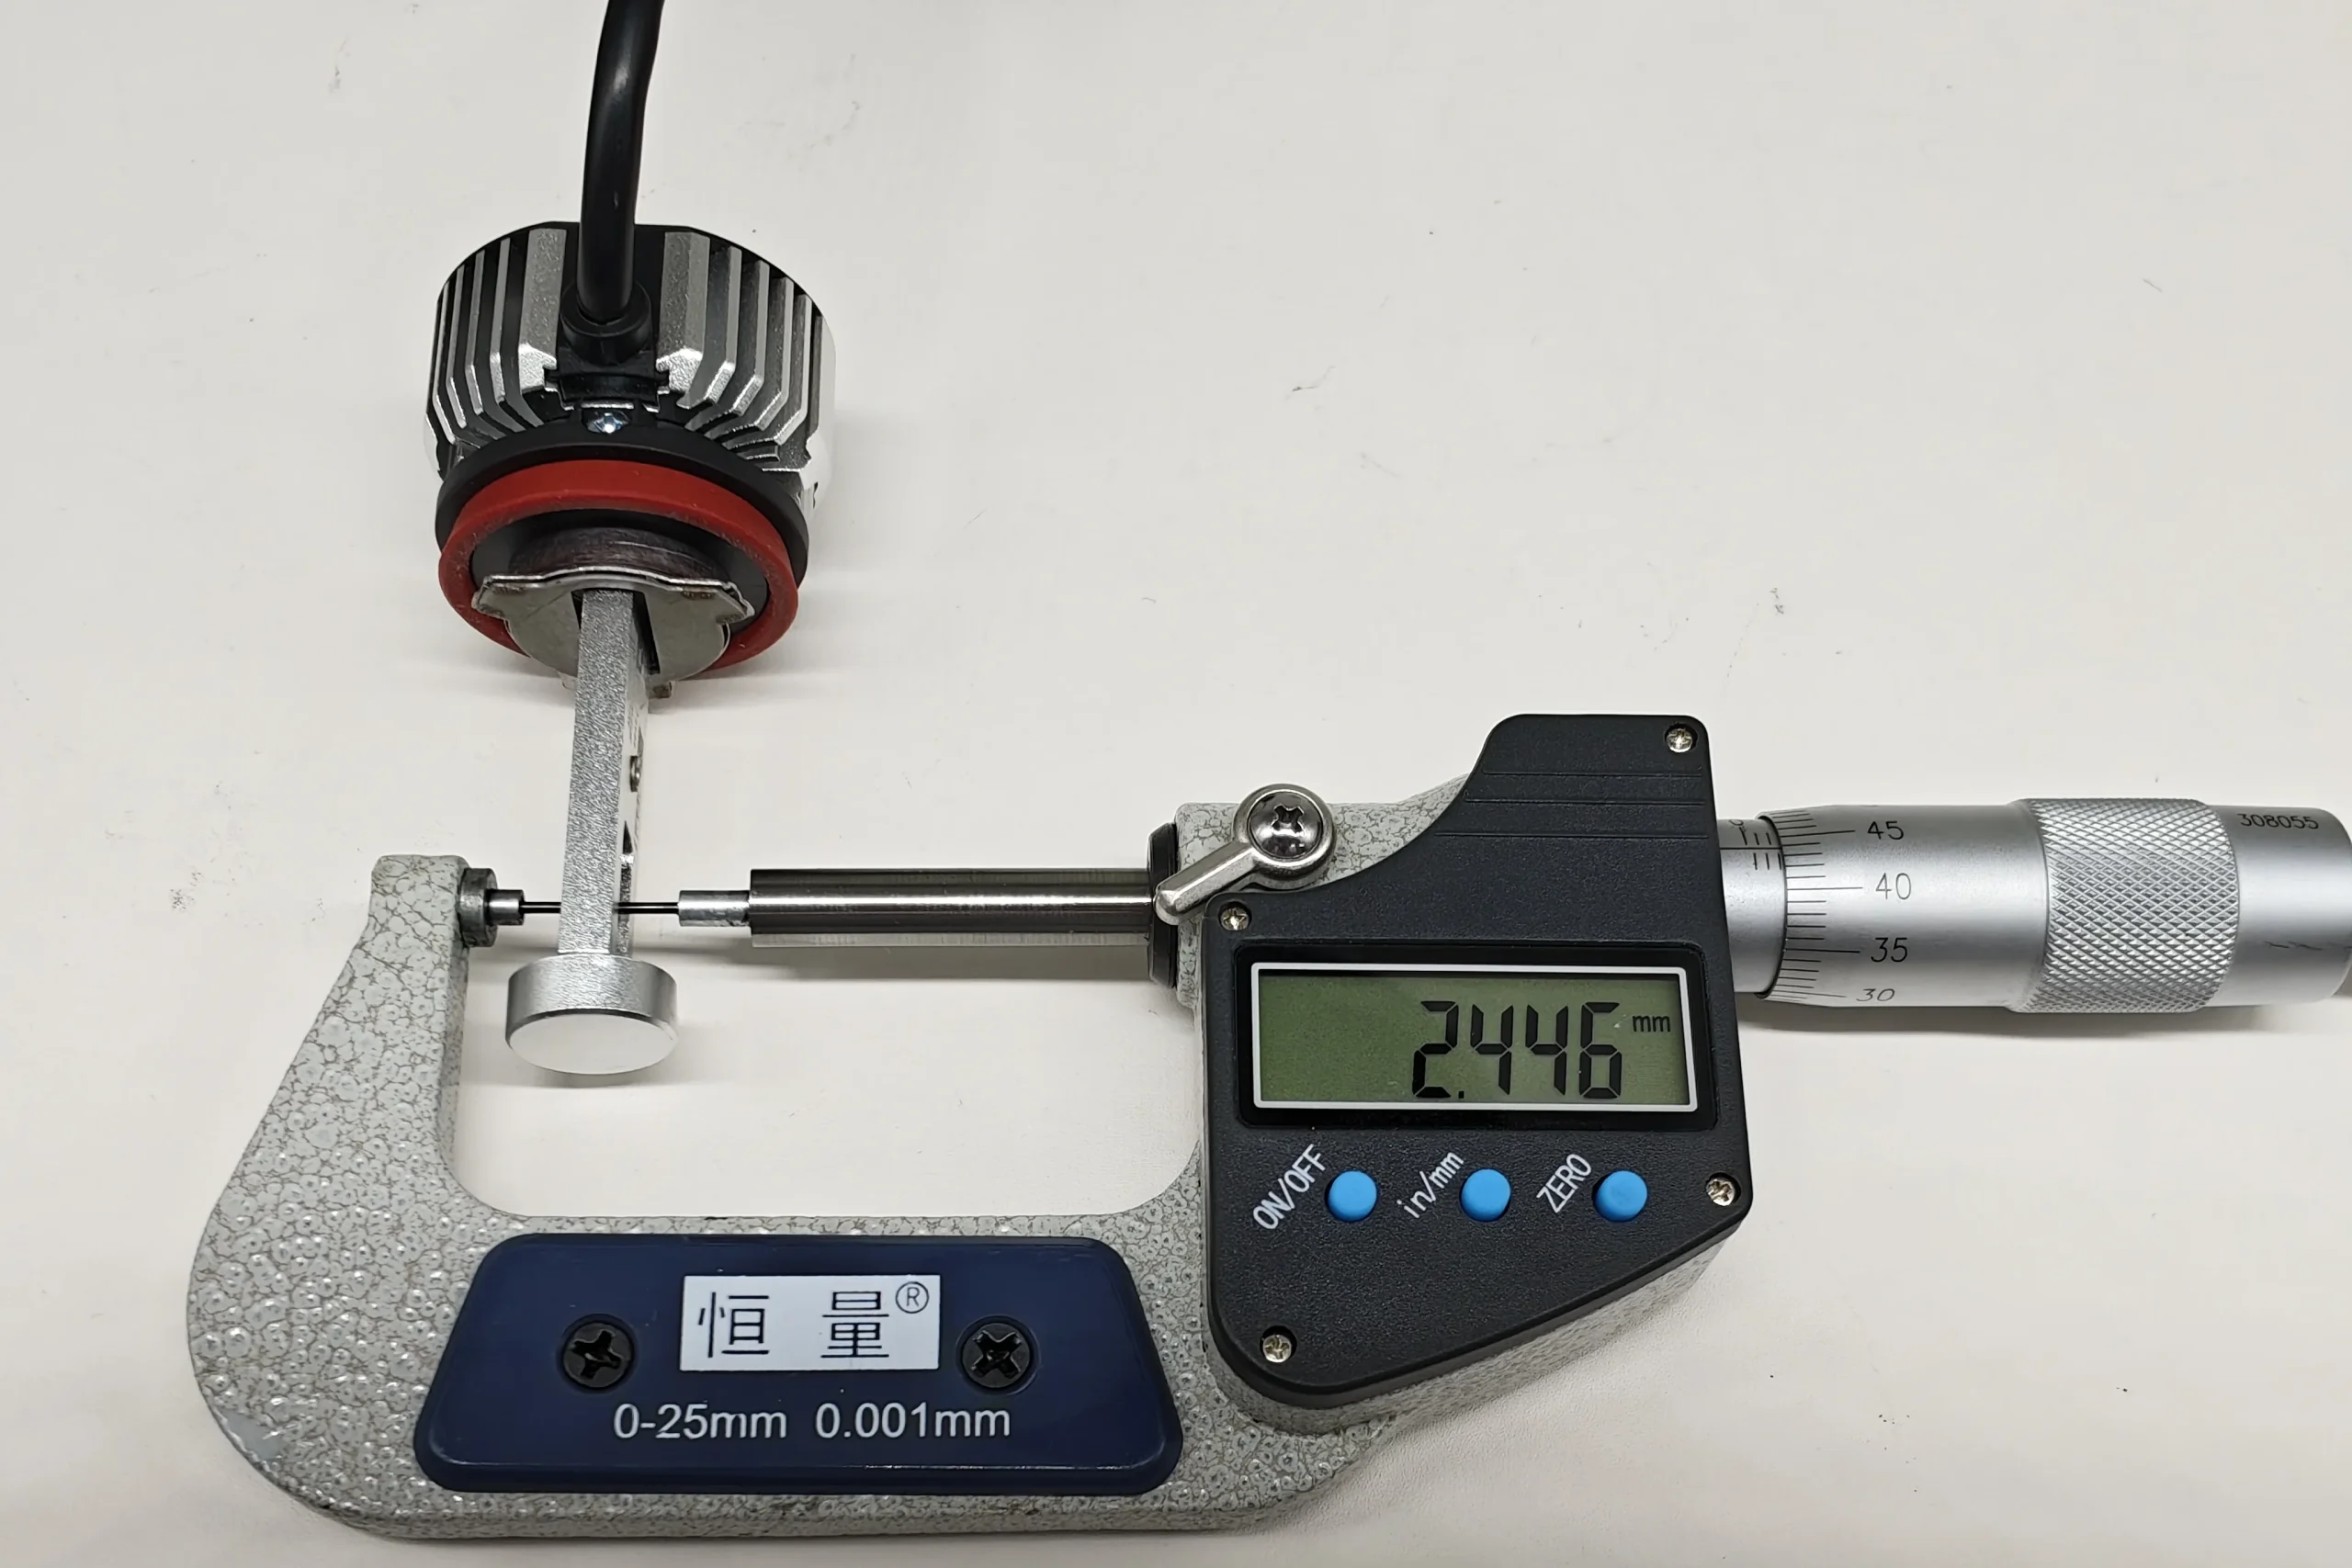
Measured distance: The distance between opposing LED emitting surfaces is 1.154 mm for EB and 2.446 mm for OSRAM. EB’s measured distance is 1.292 mm smaller, or 52.82% lower than OSRAM’s.
Box system reference-frame check
The reference-frame images compare where each visible emitting structure sits within the H11 LEDr A–C envelope and its B1–B3 divisions.
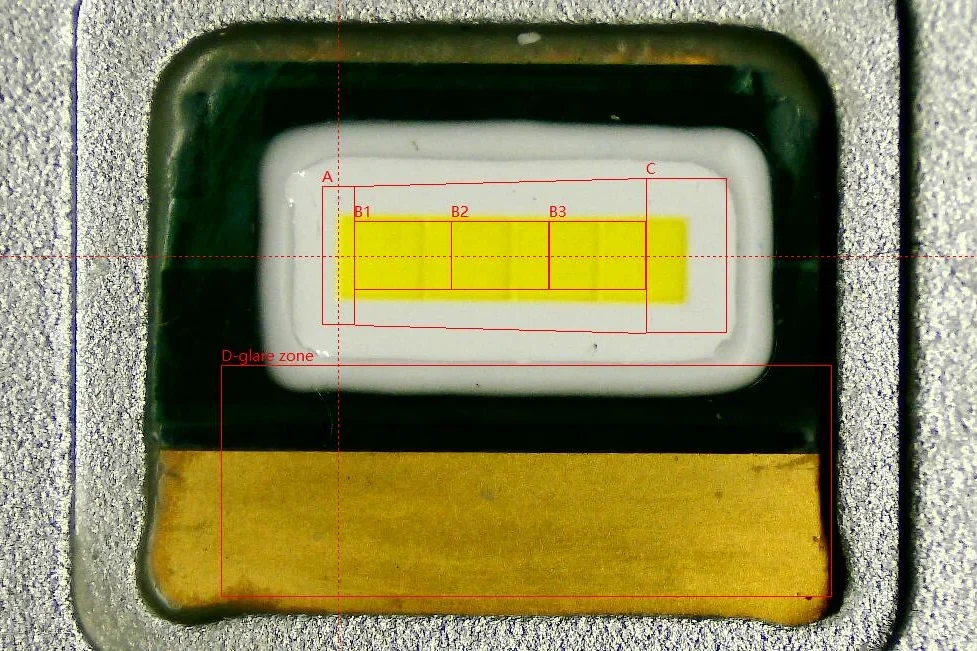
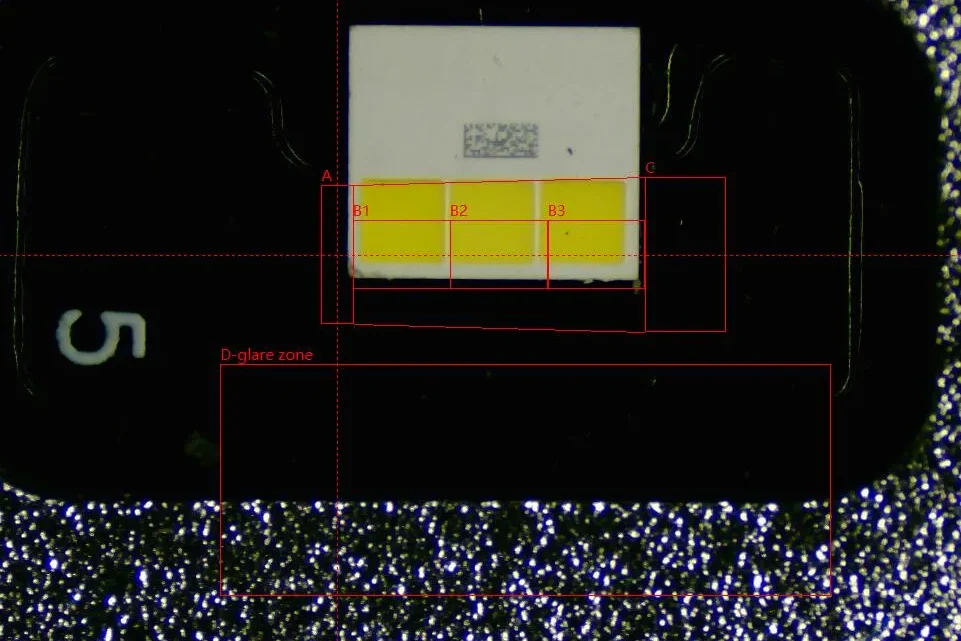
Reference-frame record: Both samples place the visible emitting structure in the upper A–C area, with the D region below. For H11 LEDr Configuration 2, the related dimensional limit is a maximum 2.9 mm between opposing LED emitting surfaces. EB measures 1.154 mm and OSRAM 2.446 mm, leaving recorded margins of 1.746 mm and 0.454 mm respectively.
Box system with the emitting area illuminated
Illumination makes the vertical distribution within B1, B2 and B3 easier to distinguish.
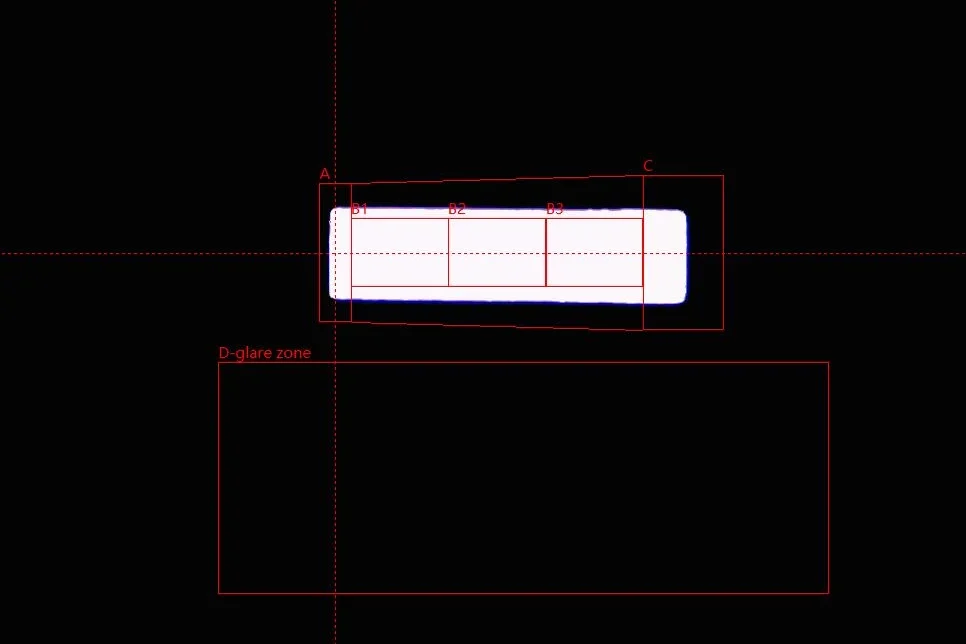
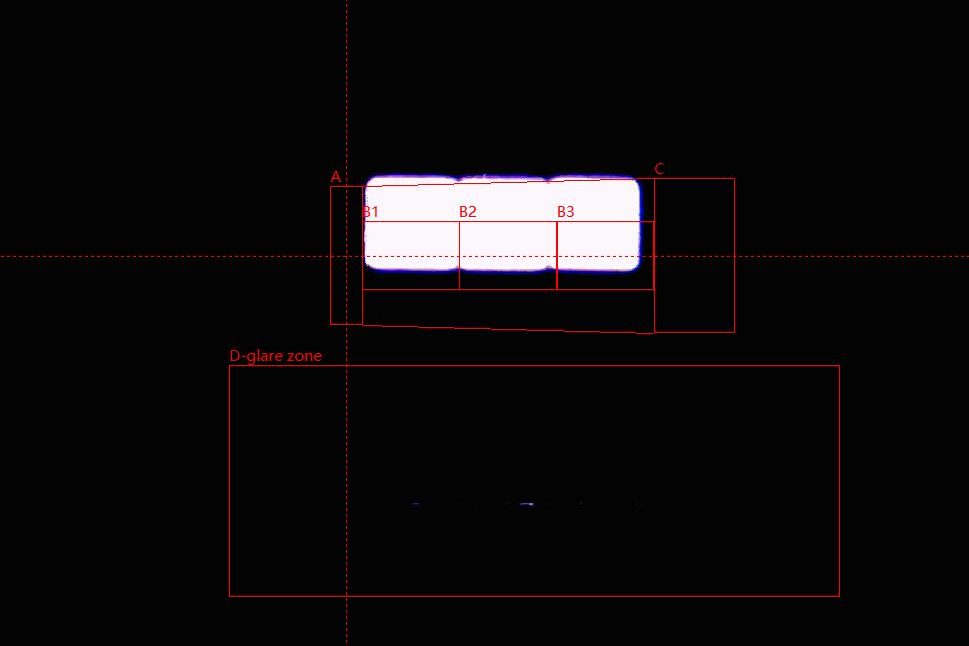
What the images show: EB’s illuminated area extends through most of the height of B1, B2 and B3. OSRAM’s illuminated area is concentrated mainly in the upper portion of the three divisions, leaving a darker band below. The D region remains dark in both images.
LED Emitting Geometry and Box-System Comparison
| Comparison item | H11 LEDr reference | EB | OSRAM | Buyer reading |
|---|---|---|---|---|
| Visible emitting-area geometry | — | Continuous rectangular window | Three separate rectangular segments | Different visible emitting-area layouts |
| Distance between opposing LED emitting surfaces | Configuration 2: maximum 2.9 mm | 1.154 mm | 2.446 mm | EB is 1.292 mm smaller and 52.82% lower |
| Illuminated B1–B3 distribution | Each subdivision requires a measured share of B-region flux | Visible area covers most of the divisions’ height | Visible area is concentrated mainly in the upper portion | EB shows fuller visible vertical coverage |
| D region | Defined contrast region below A–C | Dark in the image | Dark in the image | Shared visible feature |
Conclusion and sourcing value: EB combines a continuous rectangular emitting window with a 1.154 mm distance between opposing LED emitting surfaces. That distance is 52.82% lower than OSRAM’s and leaves 1.746 mm to the H11 LEDr Configuration 2 maximum. The illuminated images also show fuller visible coverage through B1–B3, while both samples keep the D region dark. Buyers can use the 1.154 mm measurement as a clear specification point; formal Box-system validation should additionally include the measured A/B/C flux ratios, the B1–B3 shares and the D-region contrast.
4. Beam Pattern and Illuminance Comparison
The wall photographs show the shape of the beam, the rainbow maps show how intensity spreads around the hotspot, and the nine-point readings identify where the measured differences occur.
White-wall beam pattern
Start with the cutoff and step, then use the point readings to confirm where each sample places more light below the cutoff.
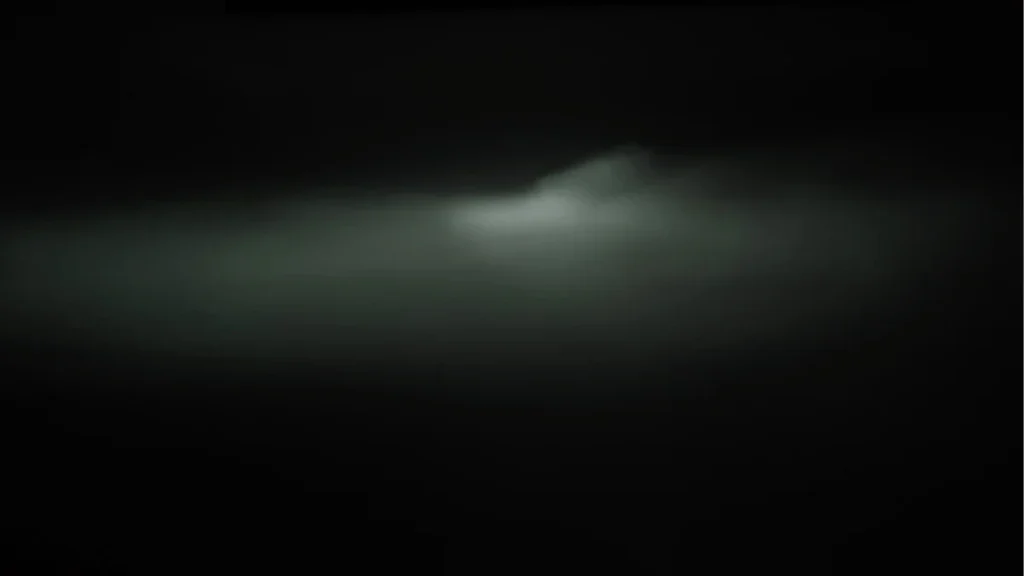
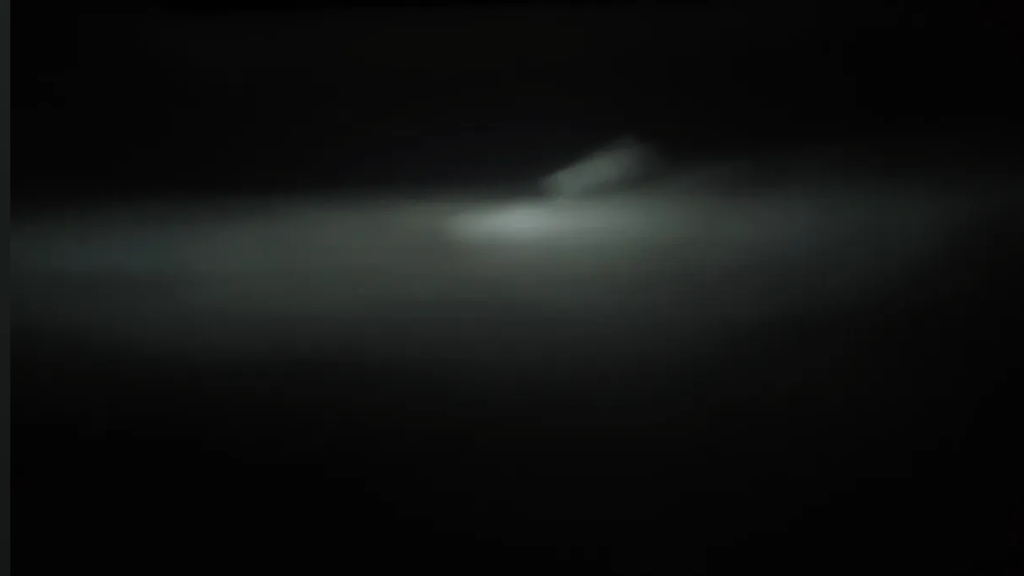
Wall-pattern reading: Both lamps form a defined cutoff with a rise to the right of centre. EB keeps the brighter area more concentrated around the step and central-right region. OSRAM forms a broader illuminated band through the centre and left.
| Visible feature | EB | OSRAM | Related measurement |
|---|---|---|---|
| Cutoff and step | Defined cutoff; rise right of centre | Defined cutoff; rise in a similar position | Common beam-pattern structure |
| Bright-area concentration | More concentrated around the central-right step | Broader through the centre and left | EB is higher at 25R, 50R, 75R and EMAX; OSRAM is higher at the centre-left points |
| Priority readings | Higher EMAX: 1,741 lux | Lower B50L: 32.0 lux | Peak illuminance and glare-control point answer different questions |
Rainbow map and hotspot distribution
The rainbow maps make the high-intensity core and the surrounding fall-off easier to compare than the wall photographs alone.
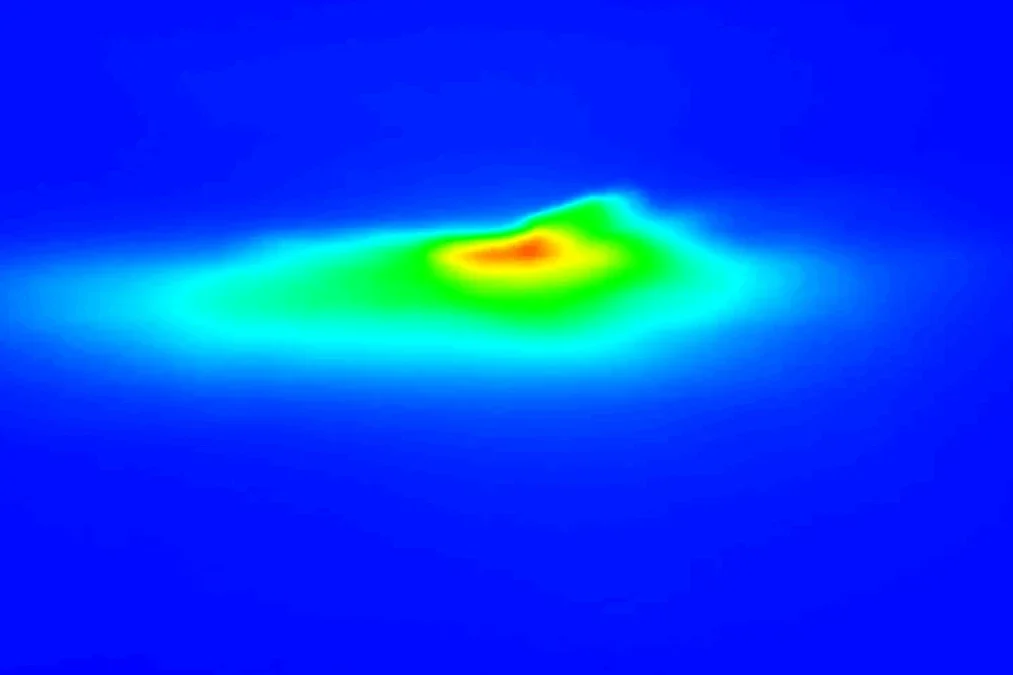
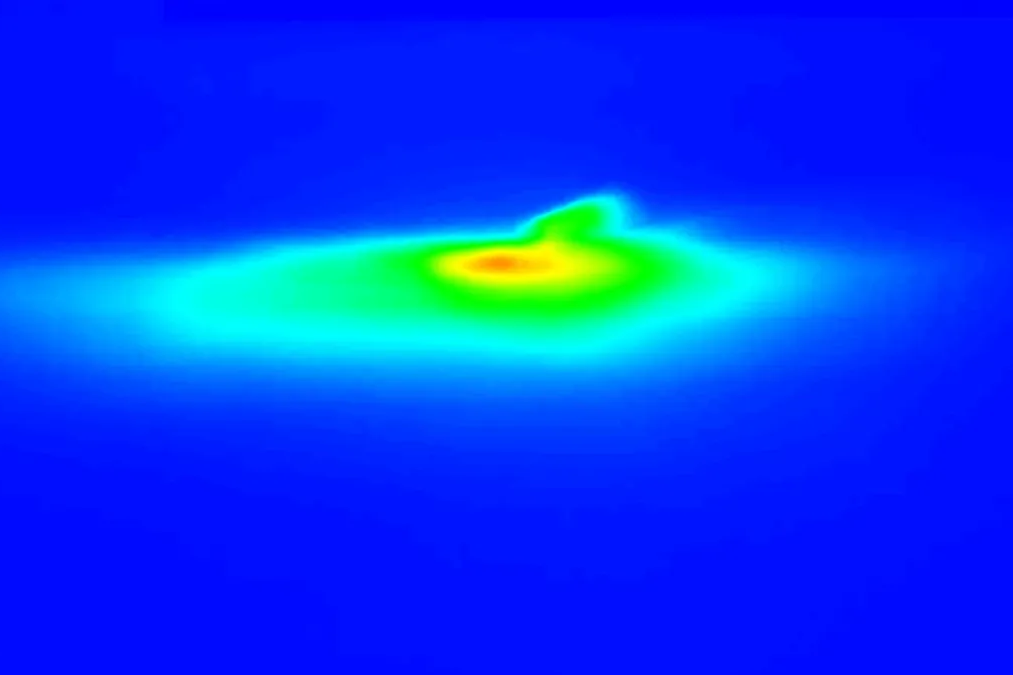
Hotspot distribution: Both hotspots remain in a similar central-right position. EB forms the tighter red-yellow core; OSRAM’s green-cyan field extends farther towards the centre-left. The pattern is consistent with EB’s higher EMAX and right-side readings and OSRAM’s higher centre-left readings.
Nine-point illuminance with B50L focus
The nine-point record turns the visual differences into specific B50L, centre, left, right and peak readings.
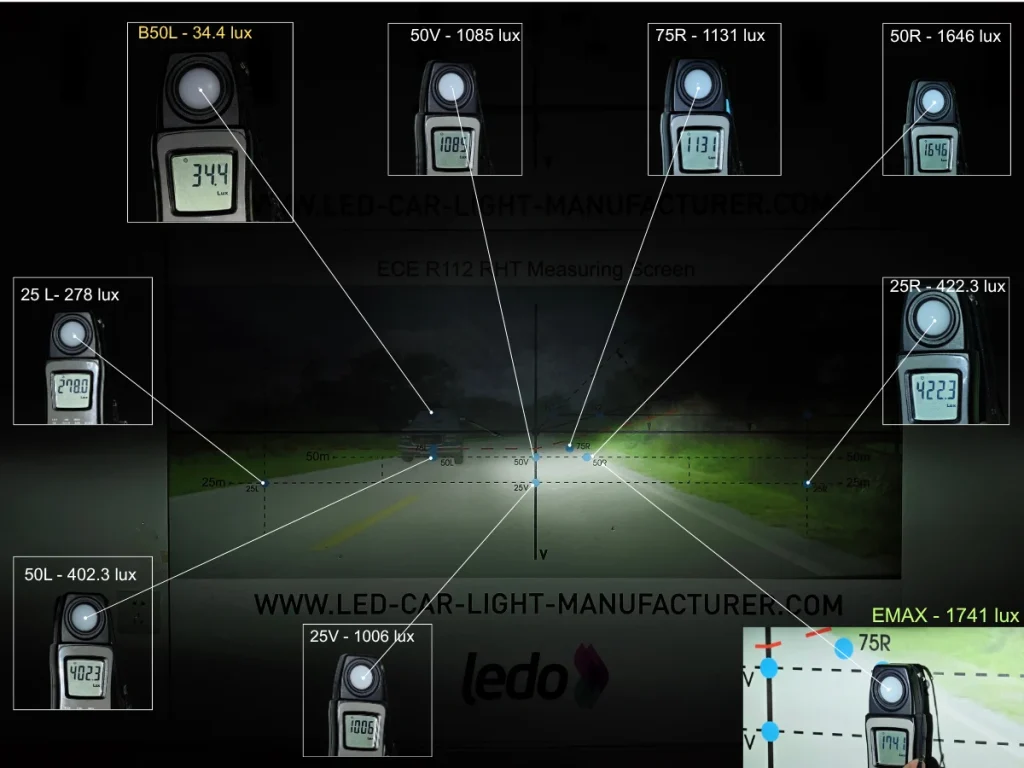
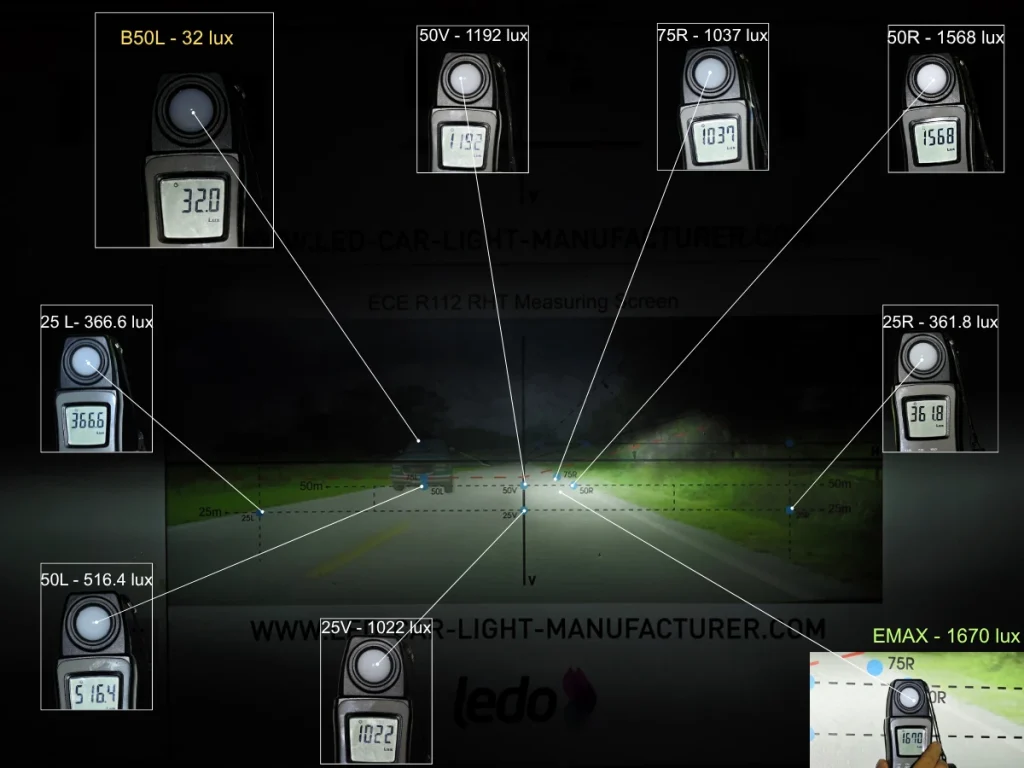
Key readings: B50L is close—32.0 lux for OSRAM and 34.4 lux for EB, a difference of 2.4 lux. At EMAX, EB reaches 1,741 lux versus 1,670 lux. EB is also higher at 25R, 50R and 75R, while OSRAM records the higher centre-left values.
How to Read the Nine-Point Results
| Point or group | Measurement purpose | Interpretation |
|---|---|---|
| B50L | Glare-control point above and left of the cut-off | Lower illuminance is preferable |
| 50L | Controlled left-side distribution below the cut-off | Must be assessed against the applicable upper and lower limits |
| 25L | Left-side illumination | Higher values indicate more light at this point; it is not a glare-control point |
| 50V / 25V | Central distribution | Shows the amount of light placed in the centre |
| 75R / 50R / 25R | Right-side distribution | Shows the amount of light placed at the right-side reference points |
| EMAX | Peak illuminance | Records the highest measured illuminance |
Complete Nine-Point Illuminance Data
| Point | EB (lux) | OSRAM (lux) | Difference (EB − OSRAM) | EB relative to OSRAM | Comparison |
|---|---|---|---|---|---|
| B50L | 34.4 | 32.0 | +2.4 | +7.50% | OSRAM records 2.4 lux less at the glare-control point |
| 25L | 278 | 366.6 | −88.6 | −24.17% | OSRAM is higher at the left-side point |
| 50L | 402.3 | 516.4 | −114.1 | −22.10% | OSRAM is higher; applicable limits determine the result |
| 50V | 1085 | 1192 | −107 | −8.98% | OSRAM is higher at the central point |
| 25V | 1006 | 1022 | −16 | −1.57% | OSRAM is slightly higher at the central point |
| 75R | 1131 | 1037 | +94 | +9.06% | EB is higher at the right-side point |
| 50R | 1646 | 1568 | +78 | +4.97% | EB is higher at the right-side point |
| 25R | 422.3 | 361.8 | +60.5 | +16.72% | EB is higher at the right-side point |
| EMAX | 1741 | 1670 | +71 | +4.25% | EB records the higher peak illuminance |
Conclusion: B50L and EMAX describe different parts of the beam. OSRAM records the lower B50L value, but the two samples are separated by only 2.4 lux: 32.0 versus 34.4 lux. EB records the higher EMAX at 1,741 lux, 4.25% above OSRAM, and is also higher at all three right-side points—25R, 50R and 75R. OSRAM places more measured light through the centre-left. For buyers, EB’s advantage is the combination of higher peak output and consistently higher right-side readings, rather than a single isolated value. These 3.5 m readings compare the two samples; approval limits require the prescribed regulatory test setup.
5. Temperature and Fan Noise
Comparison focus: Emitting-area surface temperature after 30 minutes and fan noise measured at 3.5 cm.
Emitting-Area Surface Temperature After 30 Minutes
This measurement compares emitting-area surface temperature after 30 minutes under the same conditions.
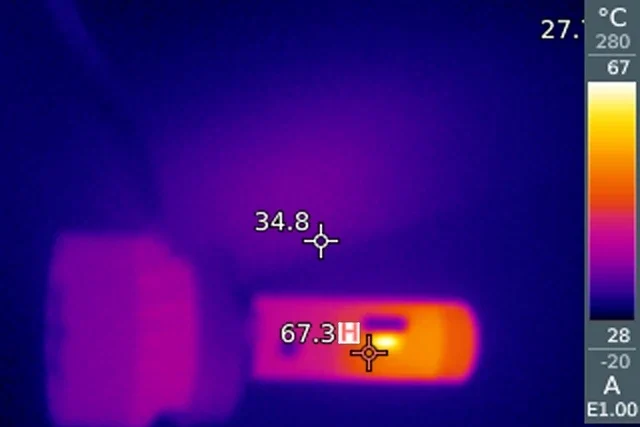
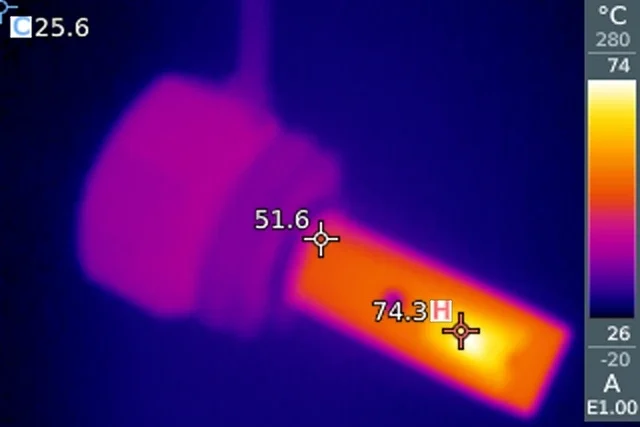
Temperature readings:The emitting-area surface temperature is 67.3°C for EB and 74.3°C for OSRAM.
Operating noise at 3.5 cm from the fan
This measurement compares operating sound level 3.5 cm from the cooling fan.
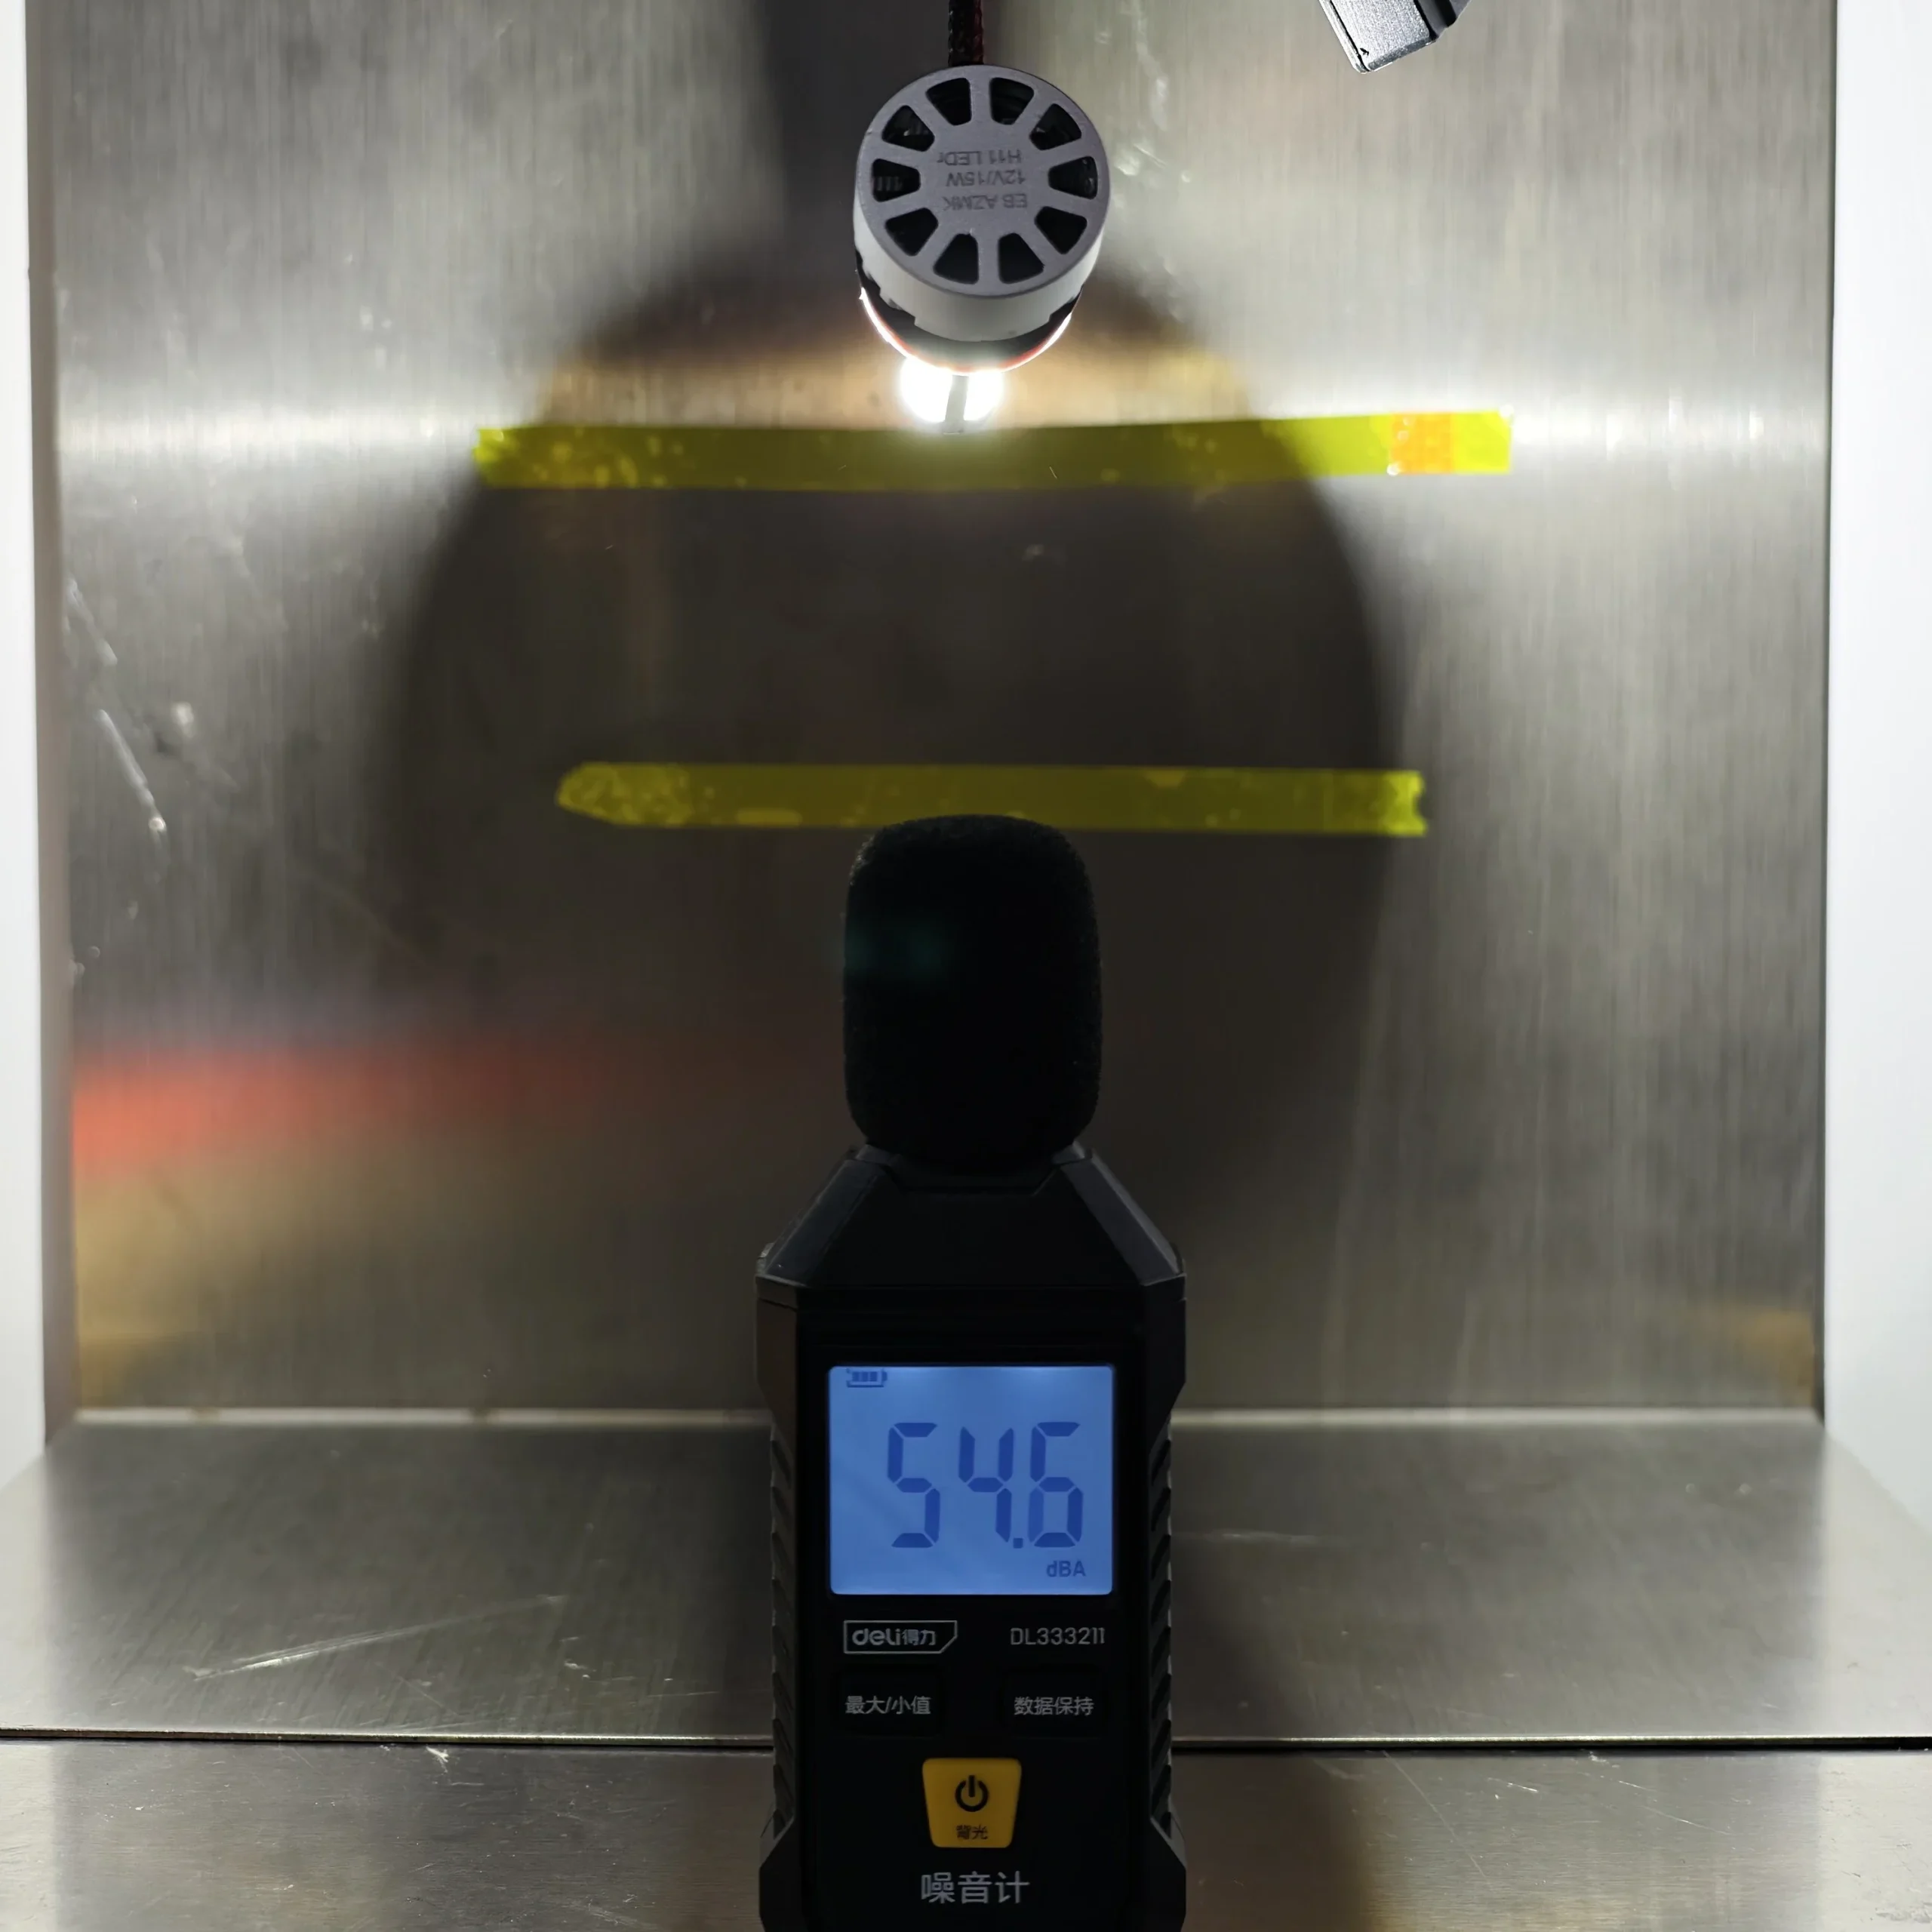
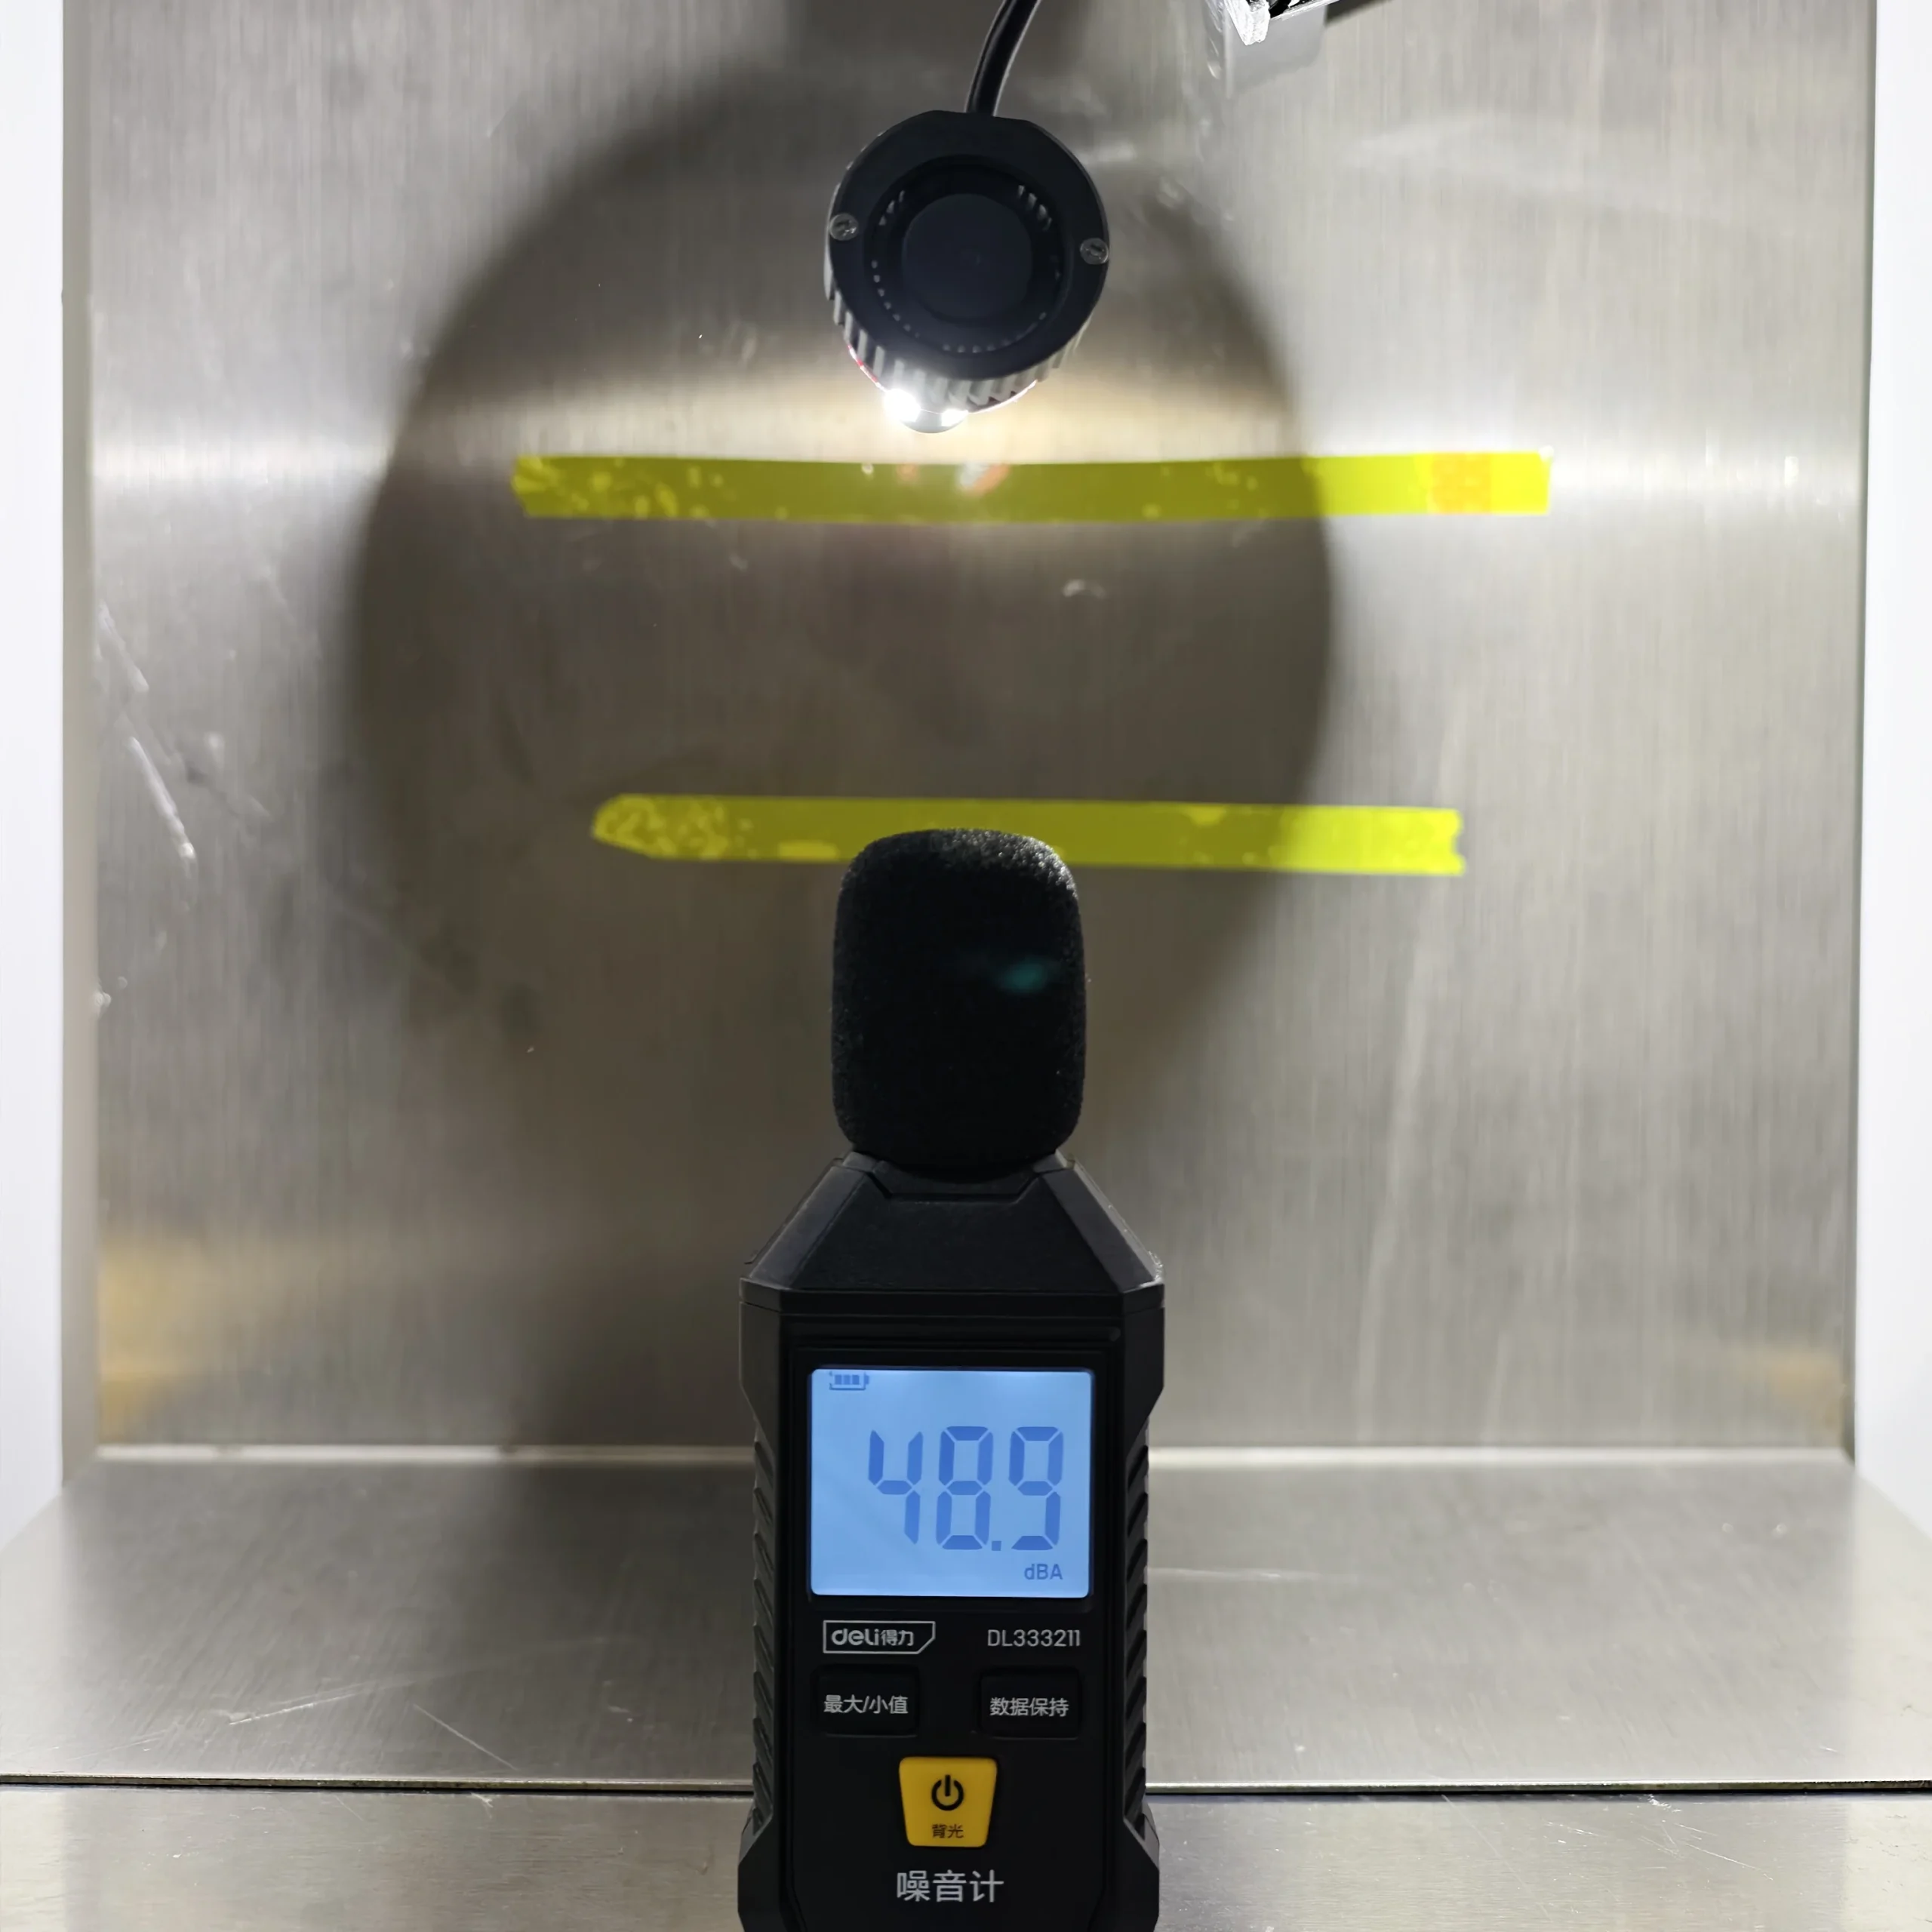
Noise at 3.5 cm:EB records 54.6 dBA and OSRAM 48.9 dBA, a difference of 5.7 dBA.
| Metric | Condition | EB | OSRAM | Result |
|---|---|---|---|---|
| Emitting-area surface temperature | 13.2 V, 26 °C, after 30 minutes | 67.3 °C | 74.3 °C | EB is 7.0 °C lower |
| Fan noise | Measured 3.5 cm from the fan | 54.6 dBA | 48.9 dBA | OSRAM is 5.7 dBA lower |
Conclusion: After 30 minutes, EB’s emitting-area surface temperature is 7.0 °C lower. At 3.5 cm, OSRAM’s fan noise is 5.7 dBA lower.
6.What This Comparison Means for Customers
- EB’s package uses 37.60% less volume and 43.33% less empty-package mass. For bulk orders, this reduces the carton space and packaging weight required for storage and transport.
- EB uses a continuous rectangular emitting window, with 1.154 mm between opposing LED emitting surfaces compared with OSRAM’s 2.446 mm. This gives EB a more compact dual-sided light-source geometry.
- EB records higher illuminance at 25R, 50R, 75R and EMAX. At EMAX, EB measures 1,741 lux versus OSRAM’s 1,670 lux.
- After 30 minutes of operation, EB’s emitting-area surface temperature is 7.0 °C lower than OSRAM’s.
- At B50L, EB measures 34.4 lux and OSRAM 32.0 lux—a difference of only 2.4 lux. Because this is a glare-control point, the lower OSRAM reading is preferable, but the two results are close.
- The same comparison also records OSRAM’s higher centre-left illuminance, lower fan noise at 3.5 cm and more structured retail packaging.
Both samples share the H11 connector, PGJ19-2 keyed base and metal retaining spring. Overall, the measured data gives EB its clearest advantages in packaging efficiency, compact emitting geometry, right-side and peak illuminance, and emitting-area surface temperature.
EB vs OSRAM H11 LEDr FAQ
Were the two lamps tested under the same conditions?
Yes. Both lamps operated at 13.2 V in a 26 degrees C environment. Illuminance was recorded at the same E-Mark panel points at 3.5 m after a 30-minute warm-up, temperature was recorded after 30 minutes, and noise was measured at 3.5 cm.
What does the 1.154 mm versus 2.446 mm measurement describe?
It is the distance between the two opposing LED emitting surfaces. The EB sample measured 1.154 mm and the OSRAM sample measured 2.446 mm.
How did the illuminance distribution differ?
EB was higher at 75R, 50R, 25R and EMAX. OSRAM was higher at 25L, 50L, 50V and 25V, and it recorded the lower B50L value.
How did the temperature and noise records differ?
EB recorded the lower emitting-area surface temperature, at 67.3 degrees C after 30 minutes. OSRAM recorded the lower operating-noise value, at 48.9 dBA measured 3.5 cm from the fan.
Author: Jack Liu, Co-founder & Product Director, LEDOAUTO
Regulatory check: LEDOAUTO Engineering Team, verified against official UNECE documents
Last updated: 27 Aug 2026
Update note: rewrote the comparison around reader-first explanations and section-specific insights while preserving the original measurements.
The category terminology used in this comparison follows the UNECE light-source category resolutions. Additional context is available in the ECE R37 H11 LEDr background.